

Question: Below is a graphical display of a sensitivity analysis showing the project NPV that results from changes to the base case of input variables. NPV
Below is a graphical display of a sensitivity analysis showing the project NPV that results from changes to the base case of input variables. NPV is most sensitive to changes in which of the input variables?
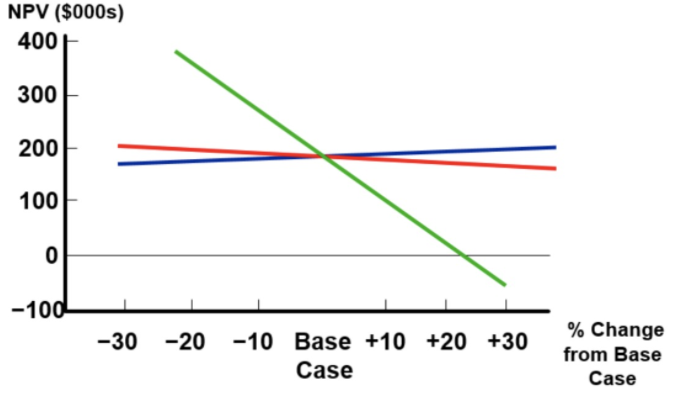
a. the variable represented by the red line
b. the variable represented by the blue line
c. the variable represented by the green line
d. the variable represented by the thin black line
NPV ($000s) 400 300 200 100 -100 % Change from Base Case -30 -20 -10 Base +10 +20 +30 0 Case
Step by Step Solution
There are 3 Steps involved in it
1 Expert Approved Answer
Step: 1 Unlock

Question Has Been Solved by an Expert!
Get step-by-step solutions from verified subject matter experts
Step: 2 Unlock
Step: 3 Unlock