

Question: Below is a network diagram, with times shown in days. Use Table B1 and Table B2. a. Determine the expected duration of the project. (Round
Below is a network diagram, with times shown in days. Use Table B1 and Table B2.
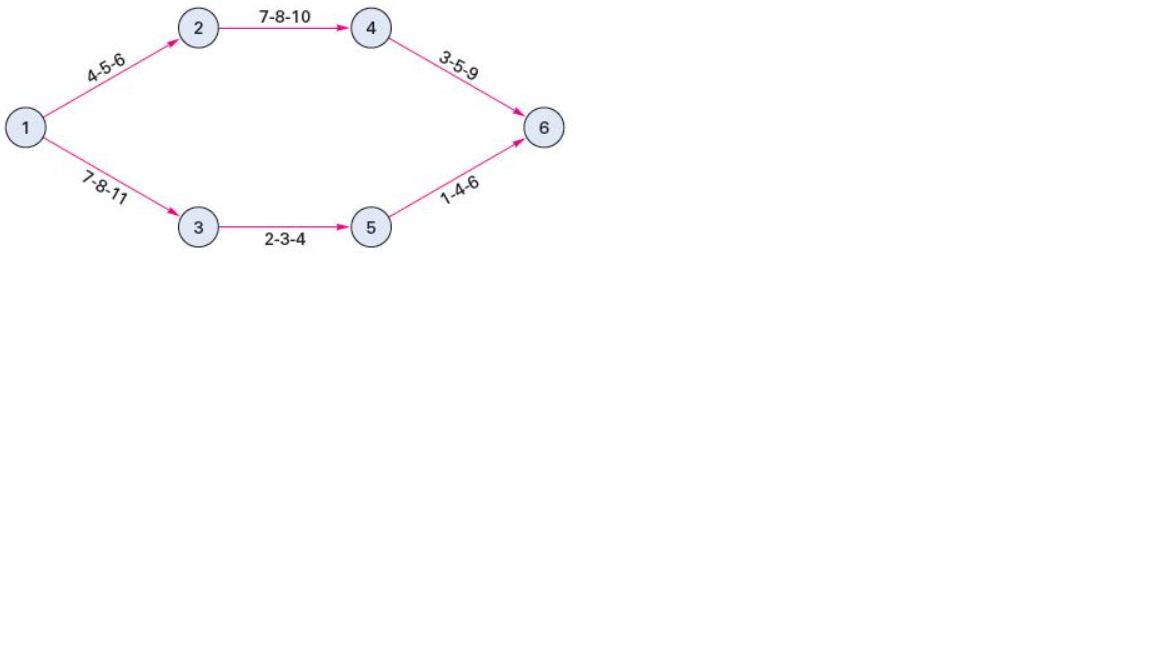
a. Determine the expected duration of the project. (Round intermediate calculations to 2 decimal places and final answer to 1 decimal place.) expected duration ____
b. Compute the probability that the project will take at least 18 days. (Round intermediate calculations to 2 decimal places and "Probability" values to 4 decimal places.)
Probability ____
7-8-10 2 4 3-5-9 4-5-6 7-8-11 1-4-6 3 5 2-3-4 7-8-10 2 4 3-5-9 4-5-6 7-8-11 1-4-6 3 5 2-3-4Step by Step Solution
There are 3 Steps involved in it
1 Expert Approved Answer
Step: 1 Unlock

Question Has Been Solved by an Expert!
Get step-by-step solutions from verified subject matter experts
Step: 2 Unlock
Step: 3 Unlock