

Question: Below is a set of data that represents the velocity (in feet per second) of the final 45 seconds of the landing. At t
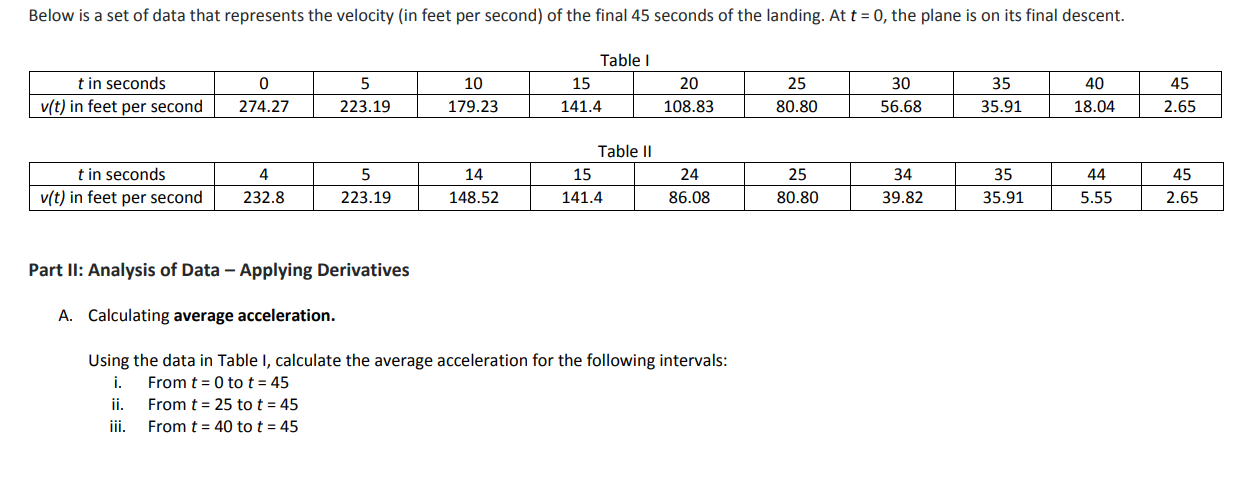
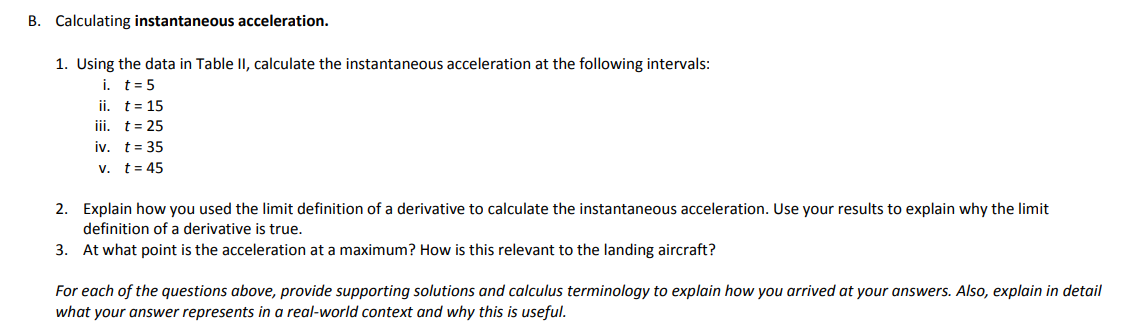
Below is a set of data that represents the velocity (in feet per second) of the final 45 seconds of the landing. At t = 0, the plane is on its final descent. Table I t in seconds 0 5 10 15 20 25 v(t) in feet per second 274.27 223.19 179.23 141.4 108.83 80.80 30 56.68 35 35.91 40 18.04 45 2.65 Table II t in seconds 4 5 14 15 24 25 34 35 44 45 v(t) in feet per second 232.8 223.19 148.52 141.4 86.08 80.80 39.82 35.91 5.55 2.65 Part II: Analysis of Data - Applying Derivatives A. Calculating average acceleration. Using the data in Table I, calculate the average acceleration for the following intervals: From t = 0 tot = 45 i. ii. From t = 25 tot = 45 iii. From t = 40 tot = 45 B. Calculating instantaneous acceleration. 1. Using the data in Table II, calculate the instantaneous acceleration at the following intervals: i. t=5 ii. t=15 iii. t = 25 iv. t = 35 v. t=45 2. Explain how you used the limit definition of a derivative to calculate the instantaneous acceleration. Use your results to explain why the limit definition of a derivative is true. 3. At what point is the acceleration at a maximum? How is this relevant to the landing aircraft? For each of the questions above, provide supporting solutions and calculus terminology to explain how you arrived at your answers. Also, explain in detail what your answer represents in a real-world context and why this is useful.
Step by Step Solution
There are 3 Steps involved in it

Get step-by-step solutions from verified subject matter experts