

Question: Below is a simplified table from a garage door installation company that was having trouble making a profit because of service and warranty calls. Because
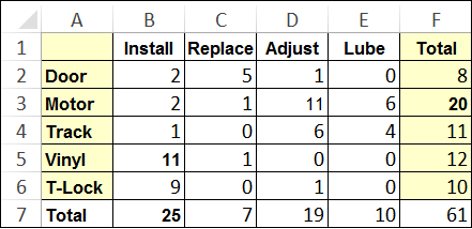
Below is a simplified table from a garage door installation company that was having trouble making a profit because of service and warranty calls. Because the company installs doors for builders, they sometimes have multiple service calls to install each door piece-by-piece. They may have to install, replace, adjust, or lubricate some part to get the door working properly. They work with five key parts: door, motor, track, vinyl trim, and T-lock. Which of the following tools would you use to analyze this problem?
| Scatter diagram Cause and effect diagram Pareto chart Histogram |
\begin{tabular}{|l|l|r|r|r|r|r|} \hline & \multicolumn{1}{|c|}{ A } & \multicolumn{1}{c|}{B} & C & \multicolumn{1}{c|}{D} & \multicolumn{1}{c|}{E} & \multicolumn{1}{c|}{F} \\ \hline 1 & & Install & Replace & Adjust & \multicolumn{1}{c|}{ Lube } & \multicolumn{1}{|c|}{ Total } \\ \hline 2 & Door & 2 & 5 & 1 & 0 & 8 \\ \hline 3 & Motor & 2 & 1 & 11 & 6 & 20 \\ \hline 4 & Track & 1 & 0 & 6 & 4 & 11 \\ \hline 5 & Vinyl & 11 & 1 & 0 & 0 & 12 \\ \hline 6 & T-Lock & 9 & 0 & 1 & 0 & 10 \\ \hline 7 & Total & 25 & 7 & 19 & 10 & 61 \\ \hline \end{tabular}
Step by Step Solution
There are 3 Steps involved in it

Get step-by-step solutions from verified subject matter experts