

Question: Below is a table of probabilities and expected returns for 2 securities under 3 possible scenarios: Possible outcomes Probability Rate of Return Company G
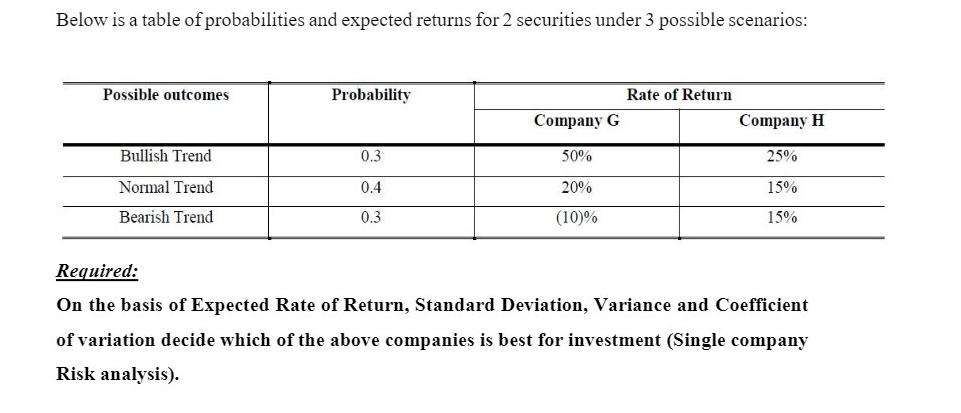
Below is a table of probabilities and expected returns for 2 securities under 3 possible scenarios: Possible outcomes Probability Rate of Return Company G Company H Bullish Trend 0.3 50% 25% Normal Trend 0.4 Bearish Trend 0.3 20% (10)% 15% 15% Required: On the basis of Expected Rate of Return, Standard Deviation, Variance and Coefficient of variation decide which of the above companies is best for investment (Single company Risk analysis).
Step by Step Solution
There are 3 Steps involved in it
1 Expert Approved Answer
Step: 1 Unlock

Question Has Been Solved by an Expert!
Get step-by-step solutions from verified subject matter experts
Step: 2 Unlock
Step: 3 Unlock