

Question: Below is a two way ANOVA table showing the interaction effects in each cell. There are 36 cases (6 in each cell). +3 -2 -1
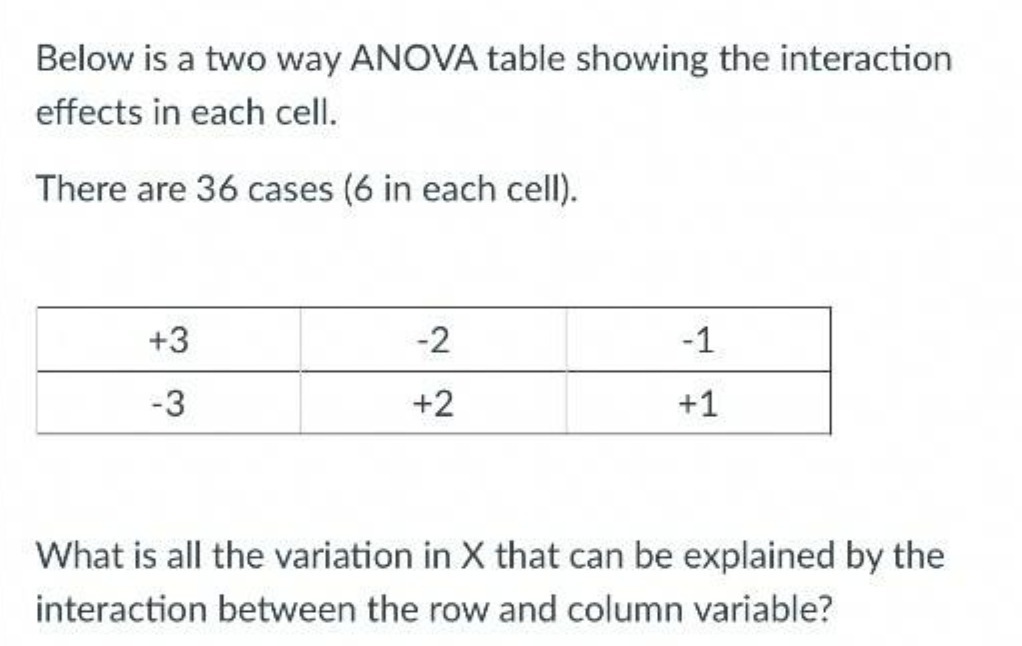
Below is a two way ANOVA table showing the interaction effects in each cell. There are 36 cases (6 in each cell). +3 -2 -1 What is all the variation in X that can be explained by the interaction between the row and column variable
Step by Step Solution
There are 3 Steps involved in it
1 Expert Approved Answer
Step: 1 Unlock

Question Has Been Solved by an Expert!
Get step-by-step solutions from verified subject matter experts
Step: 2 Unlock
Step: 3 Unlock