Question: Below is example10.4.1 Q10.4.9 from the textbook: Consider the data iven in Example 10.4.1. (a) Obtain comparison boxplots of the data. (b) Show that the
Below is example10.4.1
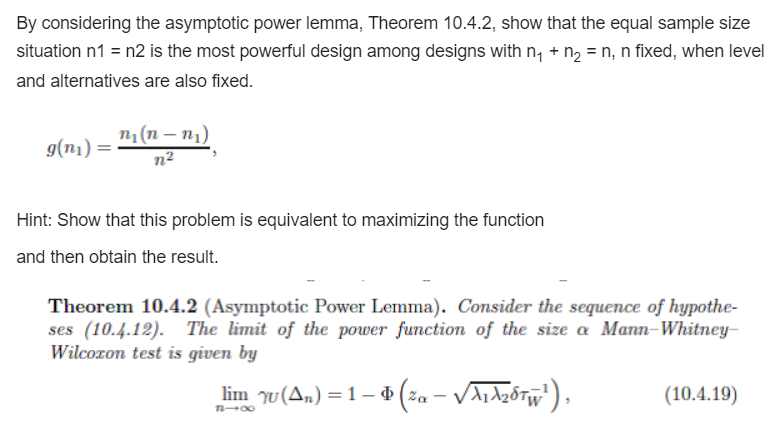
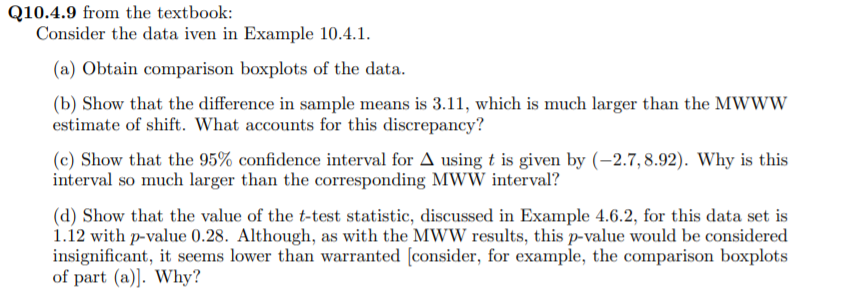
Q10.4.9 from the textbook: Consider the data iven in Example 10.4.1. (a) Obtain comparison boxplots of the data. (b) Show that the difference in sample means is 3.11, which is much larger than the MWWW estimate of shift. What accounts for this discrepancy? (c) Show that the 95% confidence interval for A using t is given by (-2.7, 8.92). Why is this interval so much larger than the corresponding MWW interval? (d) Show that the value of the t-test statistic, discussed in Example 4.6.2, for this data set is 1.12 with p-value 0.28. Although, as with the MWW results, this p-value would be considered insignificant, it seems lower than warranted consider, for example, the comparison boxplots of part (a)). Why? By considering the asymptotic power lemma, Theorem 10.4.2, show that the equal sample size situation n1 = n2 is the most powerful design among designs with ny + n2 = n, n fixed, when level and alternatives are also fixed. nin-ni) n) g(n) = n2 Hint: Show that this problem is equivalent to maximizing the function and then obtain the result. Theorem 10.4.2 (Asymptotic Power Lemma). Consider the sequence of hypothe- ses (10.4.12). The limit of the power function of the size a Mann-Whitney- Wilcoxon test is given by lim (An)=1-0 (2 (za - VAL428Tw) (10.4.19) Q10.4.9 from the textbook: Consider the data iven in Example 10.4.1. (a) Obtain comparison boxplots of the data. (b) Show that the difference in sample means is 3.11, which is much larger than the MWWW estimate of shift. What accounts for this discrepancy? (c) Show that the 95% confidence interval for A using t is given by (-2.7, 8.92). Why is this interval so much larger than the corresponding MWW interval? (d) Show that the value of the t-test statistic, discussed in Example 4.6.2, for this data set is 1.12 with p-value 0.28. Although, as with the MWW results, this p-value would be considered insignificant, it seems lower than warranted consider, for example, the comparison boxplots of part (a)). Why? By considering the asymptotic power lemma, Theorem 10.4.2, show that the equal sample size situation n1 = n2 is the most powerful design among designs with ny + n2 = n, n fixed, when level and alternatives are also fixed. nin-ni) n) g(n) = n2 Hint: Show that this problem is equivalent to maximizing the function and then obtain the result. Theorem 10.4.2 (Asymptotic Power Lemma). Consider the sequence of hypothe- ses (10.4.12). The limit of the power function of the size a Mann-Whitney- Wilcoxon test is given by lim (An)=1-0 (2 (za - VAL428Tw) (10.4.19)


