

Question: Below is experimental data on polystyrene, which fits to a curve of Rg = 0.01234 * M^0.5937, where M is molecular weight (assume Dispersity=1). A.
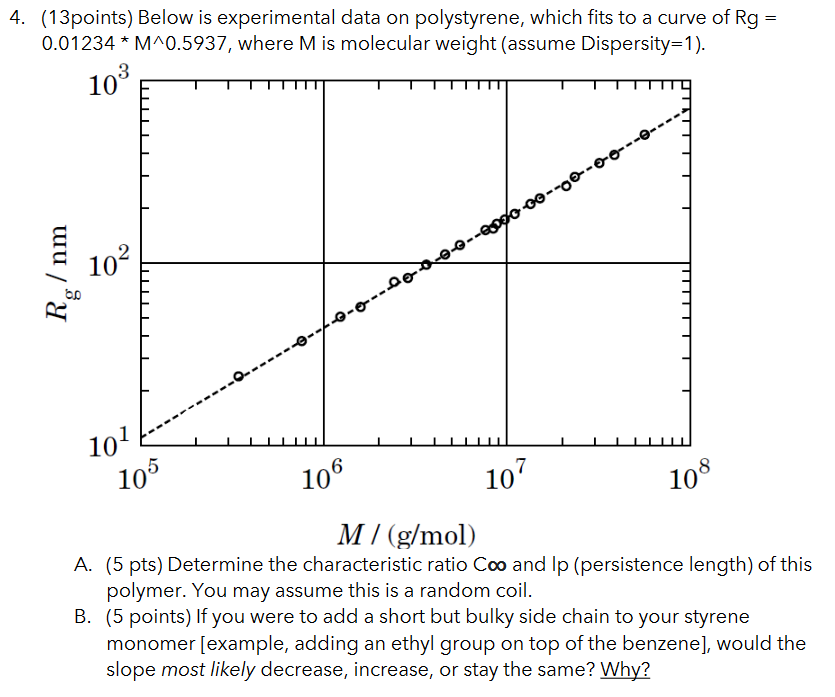
Below is experimental data on polystyrene, which fits to a curve of Rg = 0.01234 * M^0.5937, where M is molecular weight (assume Dispersity=1).
A. (5 pts) Determine the characteristic ratio C and lp (persistence length) of this polymer. You may assume this is a random coil.
B. (5 points) If you were to add a short but bulky side chain to your styrene monomer [example, adding an ethyl group on top of the benzene], would the slope most likely decrease, increase, or stay the same? Why?
C. (3 points) Was this measurement done on a molten polymer sample (pure polymer in liquid phase), or a sample in a solvent? Please explain your answer by using the data.
D. Bonus problem (bonus 3 points): pretend that, by changing the tacticity and other parameters, our new persistence length is 20nm. Please draw how the left-most third of the plot would change (ie, the portion of the plot from 10^5 to 10^6), and justify using theory we learned in class.
(13points) Below is experimental data on polystyrene, which fits to a curve of Rg= 0.01234M0.5937, where M is molecular weight (assume Dispersity=1). M/(g/mol) A. (5 pts) Determine the characteristic ratio C and Ip (persistence length) of this polymer. You may assume this is a random coil. B. (5 points) If you were to add a short but bulky side chain to your styrene monomer [example, adding an ethyl group on top of the benzene], would the slope most likely decrease, increase, or stay the same? Why? C. (3 points) Was this measurement done on a molten polymer sample (pure polymer in liquid phase), or a sample in a solvent? Please explain your answer by using the data. D. Bonus problem (bonus 3 points): pretend that, by changing the tacticity and other parameters, our new persistence length is 20nm. Please draw how the left-most third of the plot would change (ie, the portion of the plot from 105 to 106 ), and justify using theory we learned in class
Step by Step Solution
There are 3 Steps involved in it

Get step-by-step solutions from verified subject matter experts