

Question: Below is some output from an analysis predicting mortality rates in London based on the number of pubs in the region. Several numbers have been
Below is some output from an analysis predicting mortality rates in London based on the number of pubs in the region. Several numbers have been circled; for each one please report in your own words what it means - what does the statistic tell you about the model and what that particular value suggests.
a.In the Model Summary table, what statistic has the value .649, and what does it tell you?
b.In the ANOVA table, what statistic has the value .016 and what does it tell you?
c.In the Coefficients table, what statistic has the value 3351.955 and what does it tell you?
d.In the Coefficients table, what do the number 3.816 and 24.862 represent and what do they tell you?
2.Please report the results of the output in Question 4 in APA format. Remember to report on each table provided and to use the appropriate variable names.
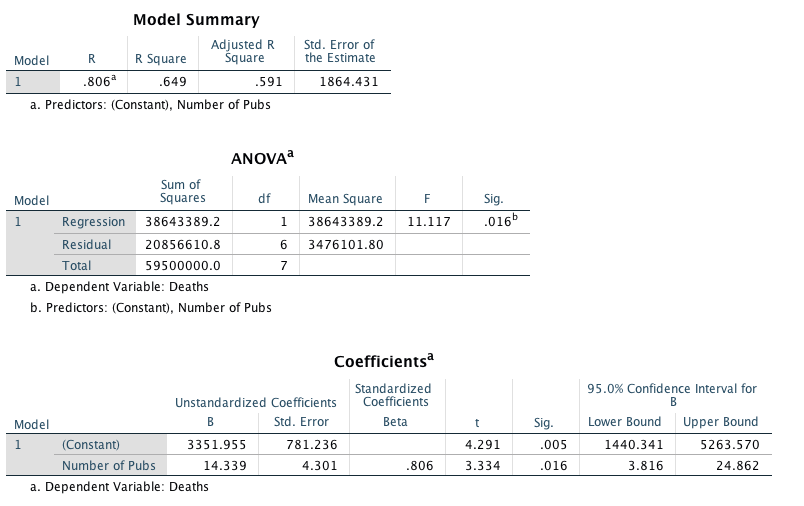
Model Summary Adjusted R Std. Error of Model R R Square Square the Estimate 1 806 649 591 1864.431 a. Predictors: (Constant), Number of Pubs ANOVA Sum of Model Squares df Mean Square F Sig. 1 Regression 38643389.2 1 38643389.2 11.117 .016 Residual 20856610.8 6 3476101.80 Total 59500000.0 7 a. Dependent Variable: Deaths b. Predictors: (Constant), Number of Pubs Coefficientsa Standardized 95.0% Confidence Interval for Unstandardized Coefficients Coefficients B Model B Std. Error Beta t Sig. Lower Bound Upper Bound 1 (Constant) 3351.955 781.236 4.291 005 1440.341 5263.570 Number of Pubs 14.339 4.301 806 3.334 .016 3.816 24.862 a. Dependent Variable: Deaths
Step by Step Solution
There are 3 Steps involved in it

Get step-by-step solutions from verified subject matter experts