

Question: Below is the comparative income statement data for Mariner, Inc. Prepare a comparative common-size income statement for Mariner, Inc. Round percentages to the nearest tenth
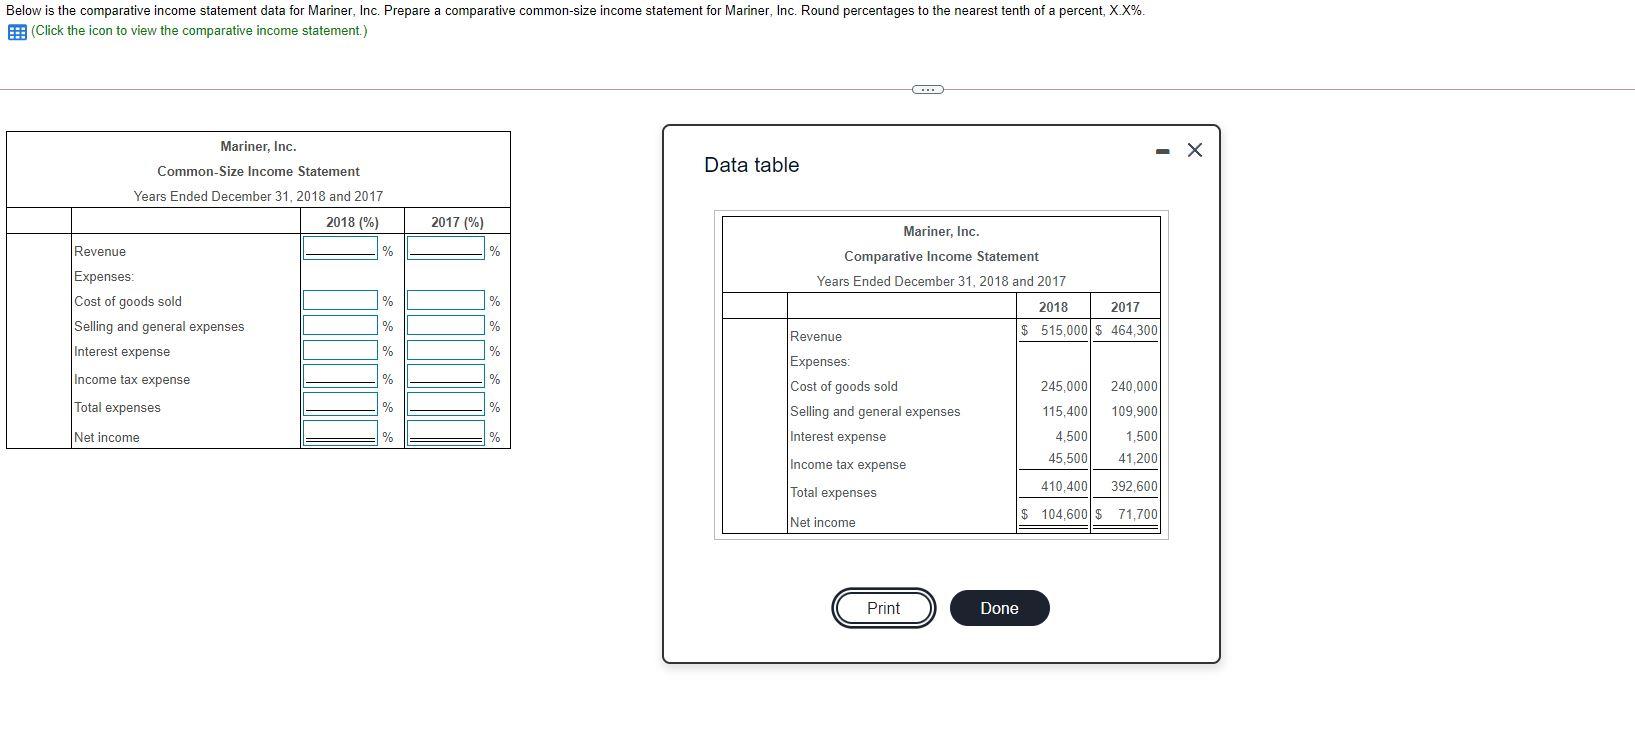
Below is the comparative income statement data for Mariner, Inc. Prepare a comparative common-size income statement for Mariner, Inc. Round percentages to the nearest tenth of a percent, X.X%. (Click the icon to view the comparative income statement.) G . Mariner, Inc. - X Data table Common-Size Income Statement Years Ended December 31, 2018 and 2017 2018 (%) 2017 (%) Mariner, Inc. Revenue % % % % Expenses: Cost of goods sold Selling and general expenses Interest expense % % % % Income tax expense % % Comparative Income Statement Years Ended December 31, 2018 and 2017 2018 2017 Revenue $ 515,000 $ 464 300 Expenses Cost of goods sold 245,000 240,000 Selling and general expenses 115,400 109,900 Interest expense 4,500 1,500 Income tax expense 45,500 41,200 Total expenses 410,400 392,600 $ 104,600 $ 71,700 Net income Total expenses % % Net income % % % Print Done
Step by Step Solution
There are 3 Steps involved in it

Get step-by-step solutions from verified subject matter experts