

Question: Below is the example code for the Elgen Face Example (Run seperatly in jupyter notebook) in Python: from sklearn.datasets import fetch_lfw_people faces = fetch_lfw_people(min_faces_per_person=60)
Below is the example code for the Elgen Face Example (Run seperatly in jupyter notebook) in Python:

from sklearn.datasets import fetch_lfw_people
faces = fetch_lfw_people(min_faces_per_person=60)
print('\nFaces to be used:\n', faces.target_names)
print('\nFaces shape:', faces.images.shape)
-----------------------------------------------------------------------------
from sklearn.decomposition import PCA as RandomizedPCA
pca = RandomizedPCA(1348)
pca.fit(faces.data)
------------------------------------------------------------------------------
%matplotlib inline
import matplotlib.pyplot as plt
import imageio
import numpy as np
import warnings
from PIL import Image
from urllib.request import urlopen
fig, axes = plt.subplots(3, 8, figsize=(9, 4),
subplot_kw={'xticks':[], 'yticks':[]},
gridspec_kw=dict(hspace=0.1, wspace=0.1))
for i, ax in enumerate(axes.flat):
ax.imshow(pca.components_[i].reshape(62, 47), cmap='bone')
------------------------------------------------------------------------------
plt.plot(np.cumsum(pca.explained_variance_ratio_))
plt.xlabel('number of components')
plt.ylabel('cumulative explained variance')
plt.show()
-----------------------------------------------------------------------------
![]()
pca = RandomizedPCA(150)
pca.fit(faces.data)
plt.plot(np.cumsum(pca.explained_variance_ratio_))
plt.xlabel('number of components')
plt.ylabel('cumulative explained variance')
plt.show()
-----------------------------------------------------------------------------
# Compute the components and projected faces
pca = RandomizedPCA(150).fit(faces.data)
components = pca.transform(faces.data)
projected = pca.inverse_transform(components)
# Plot the results
fig, ax = plt.subplots(2, 8, figsize=(10, 2.5),
subplot_kw={'xticks':[], 'yticks':[]},
gridspec_kw=dict(hspace=0.1, wspace=0.1))
for i in range(8):
ax[0, i].imshow(faces.data[i].reshape(62, 47), cmap='binary_r')
ax[1, i].imshow(projected[i].reshape(62, 47), cmap='binary_r')
ax[0, 0].set_ylabel('full-dim\ninput')
ax[1, 0].set_ylabel('150-dim\nreconstruction');
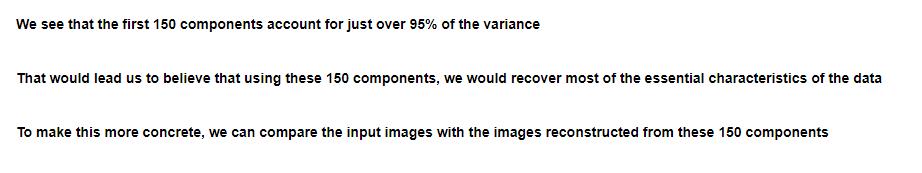
Using the Eigen Face example, set the min_faces_per_person=55 3. List the names of the faces used. 4. Show the subplots for each face of the first 3 principle components using 100 dimensions. 5. Show the final plot of the faces for the first 100 dimensions.
Step by Step Solution
There are 3 Steps involved in it

Get step-by-step solutions from verified subject matter experts