

Question: Below is the Output from a Paired Samples comparing the number of vegetables students eat, versus the number of fruits they eat. The researcher who
Below is the Output from a Paired Samples comparing the number of vegetables students eat, versus the number of fruits they eat. The researcher who conducted the study believes students eat fewer fruits than vegetables
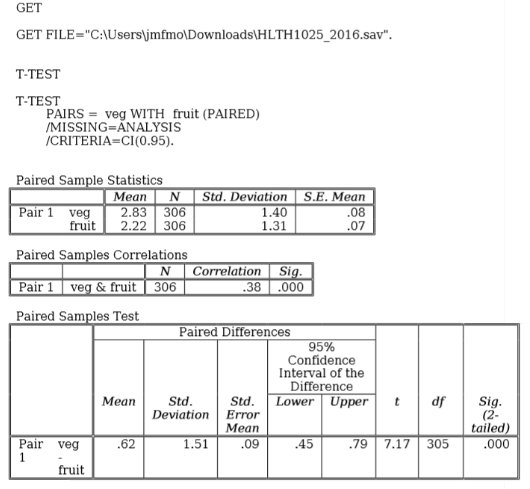
GET GET FILE-"C:\\Users\\jmfmo\\Downloads\\HLTH1025_2016.sav". T-TEST T-TEST PAIRS = veg WITH fruit (PAIRED) /MISSING=ANALYSIS /CRITERIA=CI(0.95). Paired Sample Statistics Mean N Std. Deviation S.E. Mean Pair 1 veg 2.83 306 1.40 .08 fruit 2.22 306 1.31 .07 Paired Samples Correlations N Correlation Sig. Pair 1 veg & fruit 306 38 .000 Paired Samples Test Paired Differences 95% Confidence Interval of the Difference Mean Std. Std. Lower Upper of Sig. Deviation Error (2- Mean tailed) Pair veg 62 1.51 09 .45 .79 7.17 305 .000 fruit
Step by Step Solution
There are 3 Steps involved in it

Get step-by-step solutions from verified subject matter experts