

Question: Determining Fixed vs . Variable Cost Components Using Excel ( Diagnostic Analytics ) year's sales price was ( $ 7 5 )
Determining Fixed vs Variable Cost Components Using Excel Diagnostic Analytics year's sales price was $ per unit. linked here.
Required
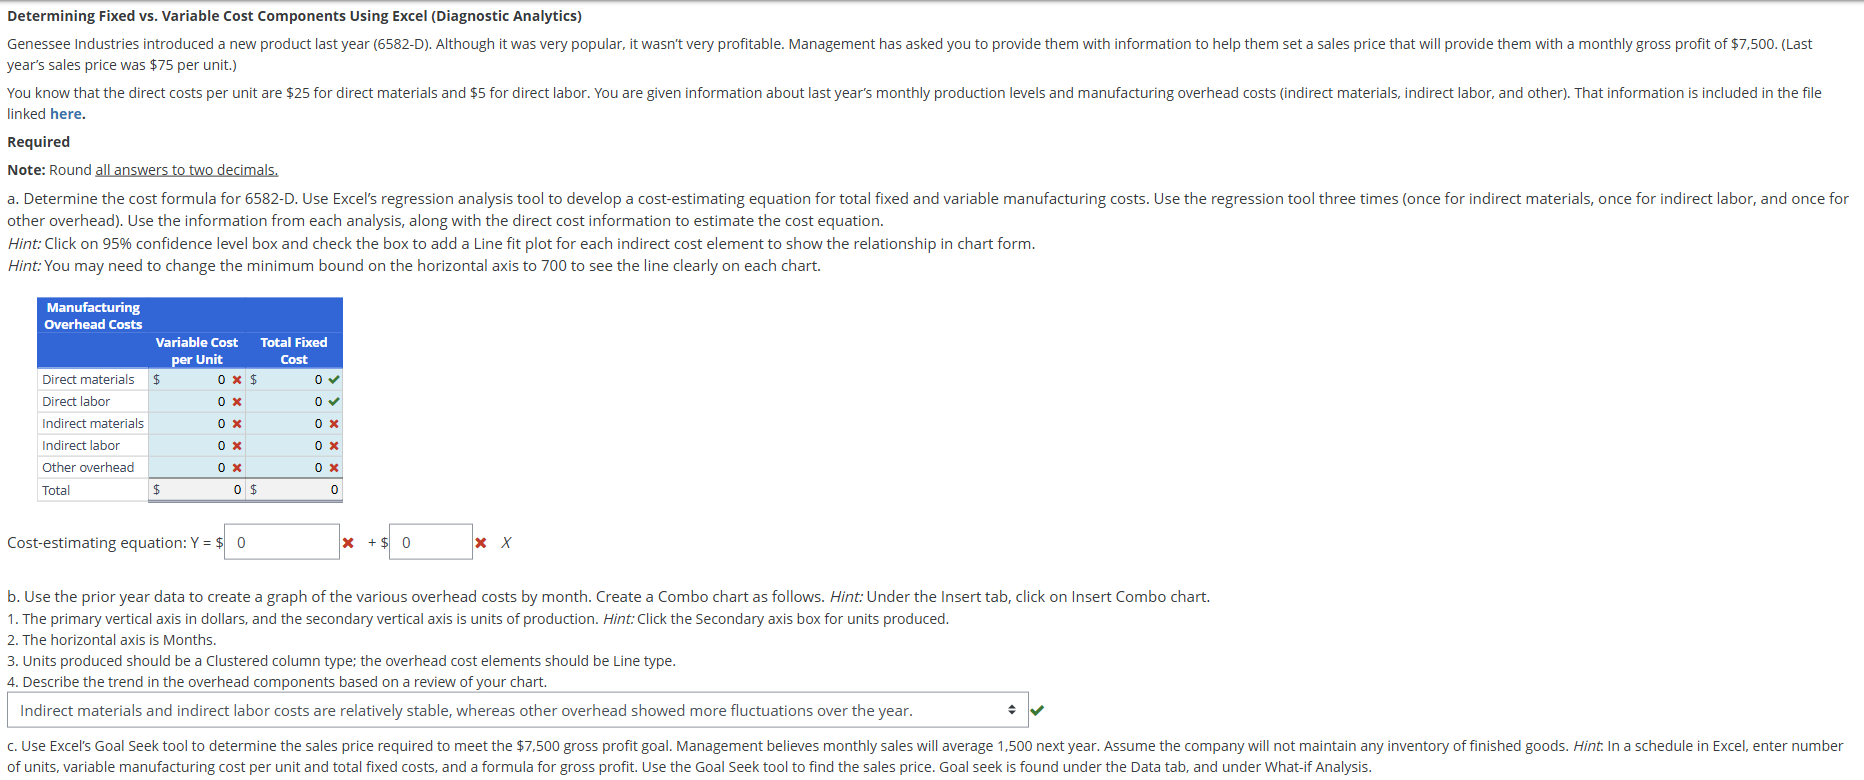
Note: Round all answers to two decimals. other overhead Use the information from each analysis, along with the direct cost information to estimate the cost equation.
Hint: Click on confidence level box and check the box to add a Line fit plot for each indirect cost element to show the relationship in chart form.
Hint: You may need to change the minimum bound on the horizontal axis to to see the line clearly on each chart.
Costestimating equation: mathrmY :
b Use the prior year data to create a graph of the various overhead costs by month. Create a Combo chart as follows. Hint: Under the Insert tab, click on Insert Combo chart.
The primary vertical axis in dollars, and the secondary vertical axis is units of production. Hint: Click the Secondary axis box for units produced.
The horizontal axis is Months.
Units produced should be a Clustered column type; the overhead cost elements should be Line type.
Describe the trend in the overhead components based on a review of your chart.
Indirect materials and indirect labor costs are relatively stable, whereas other overhead showed more fluctuations over the year. of units, variable manufacturing cost per unit and total fixed costs, and a formula for gross profit. Use the Goal Seek tool to find the sales price. Goal seek is found under the Data tab, and under Whatif Analysis.
Step by Step Solution
There are 3 Steps involved in it
1 Expert Approved Answer
Step: 1 Unlock

Question Has Been Solved by an Expert!
Get step-by-step solutions from verified subject matter experts
Step: 2 Unlock
Step: 3 Unlock