

Question: Below is the question and the sheet as it came from our professor. 7. Complete the following: A. Calculate BRCMMCs liquidity, efficiency, leverage, coverage, and
Below is the question and the sheet as it came from our professor.
7. Complete the following:
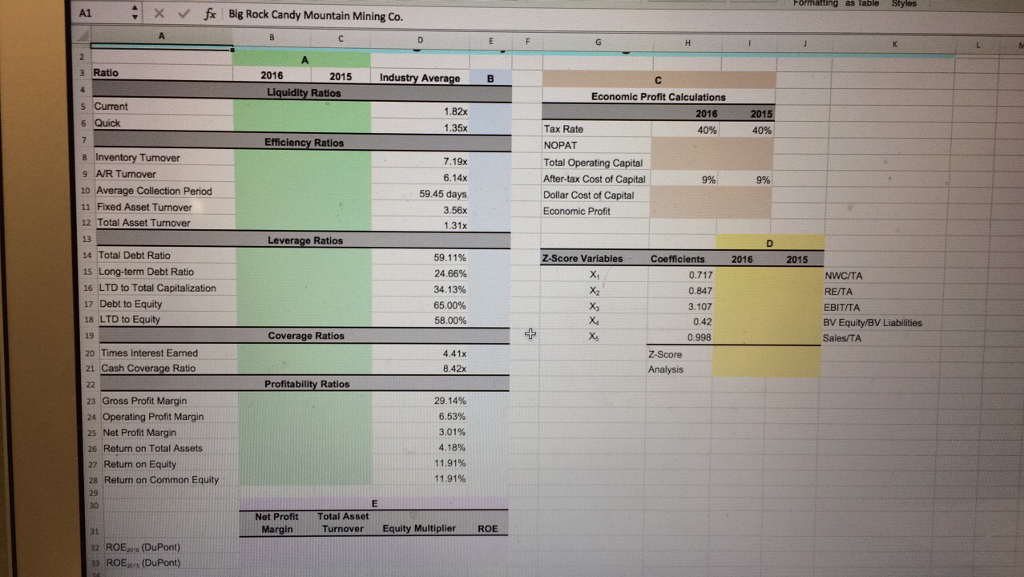
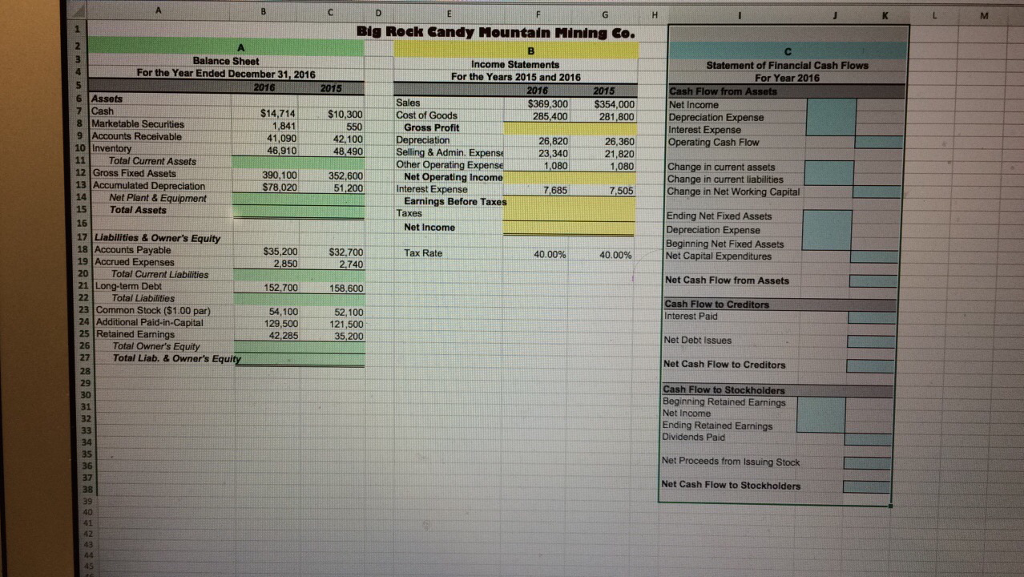
A. Calculate BRCMMCs liquidity, efficiency, leverage, coverage, and profitability ratios for 2015 and 2016 using the balance sheet and income statement from worksheet 4.
B. Using the IF, AND, and OR functions, create a simple automated system for evaluating the 2016 financial ratios for BRCMMC. For a given 2016 ratio, the function should return the text Good if the value of the 2016 ratio is better than both the industry average and the value of the ratio for 2015, Okay if the value of the 2016 ratio is better than either the industry average or ratio value for 2015, and Bad if the value of the 2016 ratio is worse than both the industry average and the ratio value for 2015.
C. Using formulas that reference the financial information in BRCMMCs balance sheet and income statement in worksheet 4, compute BRCMMCs economic profit for 2015 and 2016. Assume an after-tax cost of capital of 9%.
D. Using Altmans model for privately held firms, calculate the Z-scores for BRCMMC for 2015 and 2016. To calculate the ratios needed to compute the Z-scores, use formulas that reference the financial information in worksheet 4. For each year, use the Z-score and an IF function to conclude whether BRCMMC is in the Safe, Gray, or Distress zone.
E. Use the DuPont formula to identify the primary reason why BRCMMCs return on equity increased in 2016.
Below is number 4
If someone could help me fill in the missing blanks, with formulas and answers, it would be much appreicated. Thanks!
A1 f, Big Rock Candy Mountain Mining Co. v 3 Ratio 2016 2015 ndustry AverageB Liquidity Ratios Economic Profit Calculations s Current 6 Quick 1.82x 1.35x 2016 2015 Tax Rate NOPAT Total Operating Capital After-tax Cost of Capital Dollar Cost of Capital Economic Profit Efficiency Ratios s Inventory Tunover 9 A/R Tunover 10 Average Collection Period 11 Fixed Asset Turnover 12 Total Asset Turnover 7.19x 6.14x 59.45 days 3.56x 1.31x 9% 9% Leverage Ratios Total Debt Ratio 15 Long-term Debt Ratio 16 LTD to Total Capitalization 17 Debt to Equity 18 LTD to Equity 19 20 Times Interest Earned 21 Cash 591196 24.66% 34.13% 65 00% 58.00% Z-Score Variables Coefficients 2016 2015 NWCITA RE/TA EBIT/TA BV Equity/BV Liabilities Sales/TA 0.847 3.107 Coverage Ratios 0.998 4.41x 8.42x Z-Score Profitability Ratios 29.14% 6.53% 3.01% 4.18% 11.91% 11 91% 23 Gross Profit Margi Operating Profit Margin 2s Net Profit Margin 26 Return on Total Assets 27 Return on Equity z8 Return on Common Equity Net Profit Total Asset Margin Turnover Equity Multiplier ROE 2 ROE20% (DuPont) 33 ROEs (DuPont)
Step by Step Solution
There are 3 Steps involved in it

Get step-by-step solutions from verified subject matter experts