

Question: Below provided with a rheological measurement plot, the material involved in the measurement is silicone with condensation cured properties , the Blue curve refer to
Below provided with a rheological measurement plot, the material involved in the measurement is silicone with condensation cured properties, the Blue curve refer to the original curing properties at 180oC for 8 hours, Red curve refer to the silicone that already soaked in water for 2 hours and it seems the curing rate is increased (storage modulus, G' increase as well), however the Green curve refer to the silicone that already soaked in water for 2 hours and further air dry to continue stage at room temperature for 168 hours, it seems that further staging can reduce the curing rate (storage modulus is decreased). Can you please help to figure out the reason and chemistry happened behind? Thanks.
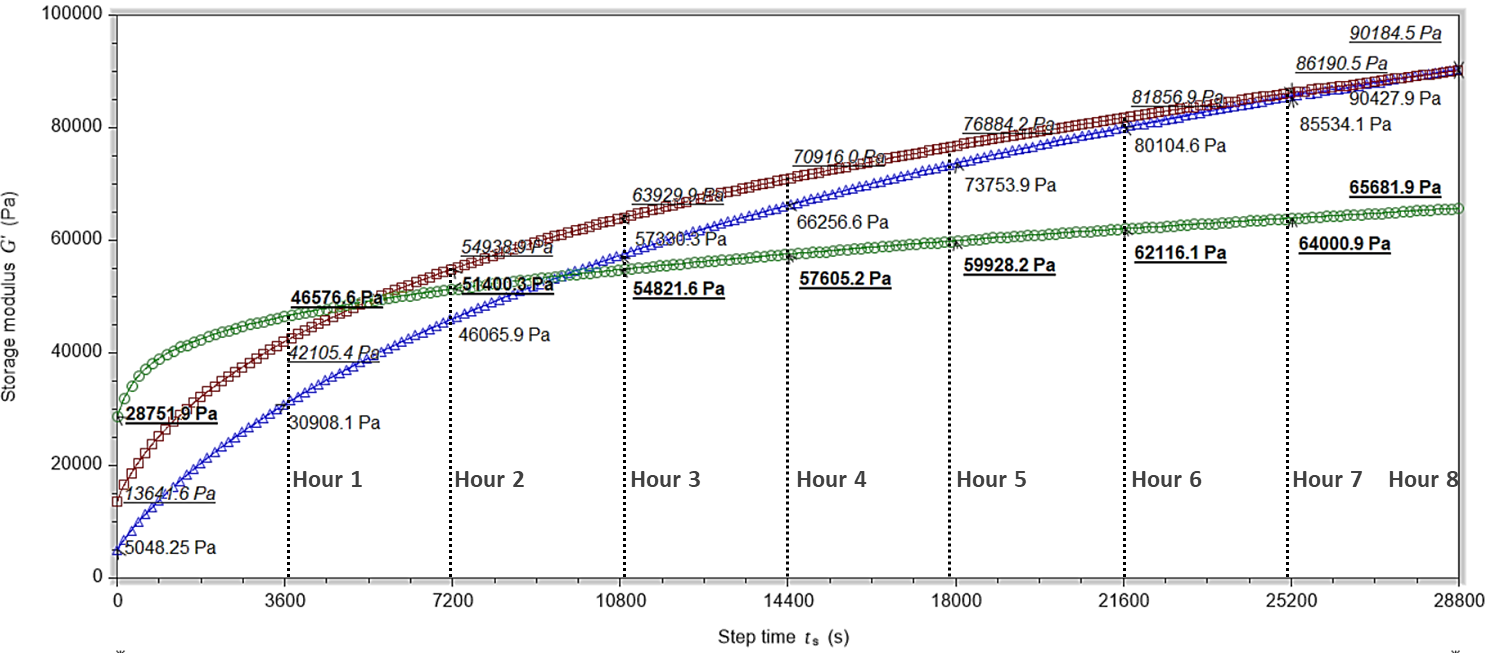
100000 90184.5 Pa 86190.5 Pa 81856 9. Pa 90427.9 Pa 85534.1 Pa 80000 768842 80104.6 Pa 70916O.RO 73753.9 Pa 639 65681.9 Pa 66256.6 Pa 60000 54938497 62116.1 Pa 64000.9 Pa 59928.2 Pa 3 Pa 54821.6 Pa 57605.2 Pa Storage modulus G' (Pa) 46576 46065.9 Pa 40000 30908.1 Pa 20000 :Hour 1 :Hour 2 : Hour 3 Hour 4 Hour 5 Hour 6 Hour 7 Hour 8 13644.6 Pa 15048.25 Pa 0 0 3600 7200 10800 14400 18000 21600 25200 28800 Step time ts (s)
Step by Step Solution
There are 3 Steps involved in it

Get step-by-step solutions from verified subject matter experts