

Question: 1. Why do we need the Ratio Analysis? 2. What does EBIT stand for? 3. What is 2019 Current Ratio? 4. What is 2019 Quick
1. Why do we need the Ratio Analysis? 2. What does EBIT stand for? 3. What is 2019 Current Ratio? 4. What is 2019 Quick Ratio? 5. What is the difference between Current Ratio and Quick Ratio? 6. What is 2019 Inventory Turnover Ratio? 7. What is 2019 DSO? 8. What is 2019 Fixed Assets Turnover ratio?
4 9. What is 2019 Total Assets Turnover ratio? 10. What is 2019 Debt Ratio? 11. What is 2019 Debt-to-Equity Ratio? 12. What is 2019 Liabilities-to-Assets Ratio? 13. What is 2019 Times Interest Earned Ratio? 14. What is 2019 Operating Profit Margin? 15. What is 2019 Profit Margin? 16. What is 2019 Gross Profit Margin? 17. What is 2019 BEP? 18. What is 2019 ROA? 19. What is 2019 ROE?
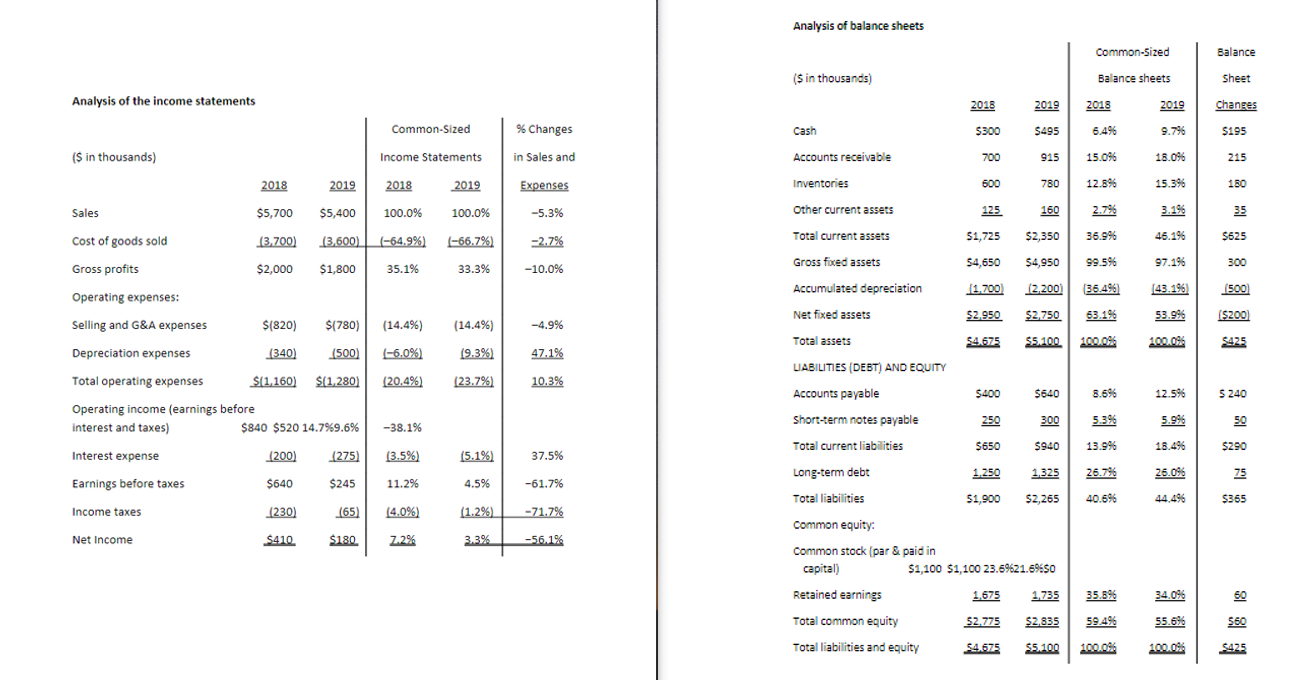
Analysis of the income statements ($ in thousands) Sales Cost of goods sold Gross profits Operating expenses: Selling and G&A expenses Depreciation expenses Total operating expenses Operating income (earnings before interest and taxes) Interest expense Earnings before taxes Income taxes Net Income Common-Sized Income Statements 2018 2019 2018 $5,400 100.0% 2019 100.0% $5,700 (3,700) (3,600) (-64.9%) (-66.7%) 35.1% $2,000 $1,800 33.3% $(820) $(780) (14.4%) (14.4%) (340) (500) (-6.0%) $(1,160) $(1,280) (20.4%) (9.3%) (23.7%) $840 $520 14.7%9.6% -38.1% (200) (275) (3.5%) (5.1%) $640 $245 11.2% 4.5% (230) (65) (4.0%) (1.2%) 7.2% 3.3% $410 $180 % Changes in Sales and Expenses -5.3% -2.7% -10.0% -4.9% 47.1% 10.3% 37.5% -61.7% -71.7% -56.1% Analysis of balance sheets ($ in thousands) Cash Accounts receivable Inventories Other current assets Total current assets Gross fixed assets Accumulated depreciation Net fixed assets Total assets LIABILITIES (DEBT) AND EQUITY Accounts payable short-term notes payable Total current liabilities Long-term debt Total liabilities Common equity: Common stock (par & paid in capital) Retained earnings Total common equity Total liabilities and equity 2018 Common-Sized Balance sheets 2019 2018 $300 700 600 $495 6.4% 915 15.0% 780 12.8% 125 160 2.7% $1,725 $2,350 36.9% $4,650 $4,950 99.5% (1,700) (2,200) (36.4%) $2.950 $2,750 63.1% $4.675 $5.100 100.0% $400 250 8.6% 5.3% $650 $640 300 $940 13.99 1,325 26.7% $2,265 40.6% 1,250 $1,900 $1,100 $1,100 23.6%621.6%650 1,675 $2,775 $4.675 $5.100 1,735 35.8% $2,835 59.4% 100.0% 2019 9.7% 18.0% 15.3% 3.196 46.196 97.196 (43.196) 53.99 100.0% 12.5% 5.996 18.496 26.0% 44.496 34.0% 55.6% 100.0% Balance Sheet Changes $195 215 180 3.5 $625 300 (500) ($200) $425 $ 240 50 $290 75 $365 60 $60 $425 Analysis of the income statements ($ in thousands) Sales Cost of goods sold Gross profits Operating expenses: Selling and G&A expenses Depreciation expenses Total operating expenses Operating income (earnings before interest and taxes) Interest expense Earnings before taxes Income taxes Net Income Common-Sized Income Statements 2018 2019 2018 $5,400 100.0% 2019 100.0% $5,700 (3,700) (3,600) (-64.9%) (-66.7%) 35.1% $2,000 $1,800 33.3% $(820) $(780) (14.4%) (14.4%) (340) (500) (-6.0%) $(1,160) $(1,280) (20.4%) (9.3%) (23.7%) $840 $520 14.7%9.6% -38.1% (200) (275) (3.5%) (5.1%) $640 $245 11.2% 4.5% (230) (65) (4.0%) (1.2%) 7.2% 3.3% $410 $180 % Changes in Sales and Expenses -5.3% -2.7% -10.0% -4.9% 47.1% 10.3% 37.5% -61.7% -71.7% -56.1% Analysis of balance sheets ($ in thousands) Cash Accounts receivable Inventories Other current assets Total current assets Gross fixed assets Accumulated depreciation Net fixed assets Total assets LIABILITIES (DEBT) AND EQUITY Accounts payable short-term notes payable Total current liabilities Long-term debt Total liabilities Common equity: Common stock (par & paid in capital) Retained earnings Total common equity Total liabilities and equity 2018 Common-Sized Balance sheets 2019 2018 $300 700 600 $495 6.4% 915 15.0% 780 12.8% 125 160 2.7% $1,725 $2,350 36.9% $4,650 $4,950 99.5% (1,700) (2,200) (36.4%) $2.950 $2,750 63.1% $4.675 $5.100 100.0% $400 250 8.6% 5.3% $650 $640 300 $940 13.99 1,325 26.7% $2,265 40.6% 1,250 $1,900 $1,100 $1,100 23.6%621.6%650 1,675 $2,775 $4.675 $5.100 1,735 35.8% $2,835 59.4% 100.0% 2019 9.7% 18.0% 15.3% 3.196 46.196 97.196 (43.196) 53.99 100.0% 12.5% 5.996 18.496 26.0% 44.496 34.0% 55.6% 100.0% Balance Sheet Changes $195 215 180 3.5 $625 300 (500) ($200) $425 $ 240 50 $290 75 $365 60 $60 $425
Step by Step Solution
There are 3 Steps involved in it

Get step-by-step solutions from verified subject matter experts