

Question: Below represents data from 3 different STAT 250 classes, specific to their first exam grades. The summary statistics for each class are stated, as
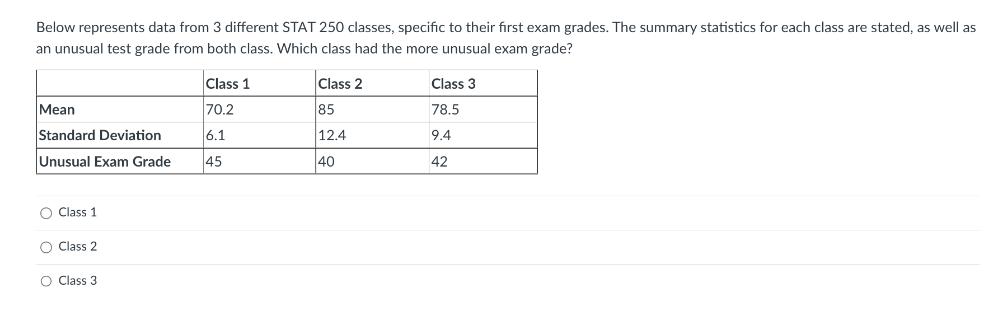
Below represents data from 3 different STAT 250 classes, specific to their first exam grades. The summary statistics for each class are stated, as well as an unusual test grade from both class. Which class had the more unusual exam grade? Mean Standard Deviation Unusual Exam Grade O Class 1 O Class 2 O Class 3 Class 1 70.2 6.1 45 Class 2 85 12.4 40 Class 3 78.5 9.4 42
Step by Step Solution
★★★★★
3.46 Rating (156 Votes )
There are 3 Steps involved in it
1 Expert Approved Answer
Step: 1 Unlock

From the given data we calculate Corresponding to each class to 2score 2 Scores ... View full answer
Question Has Been Solved by an Expert!
Get step-by-step solutions from verified subject matter experts
Step: 2 Unlock
Step: 3 Unlock