

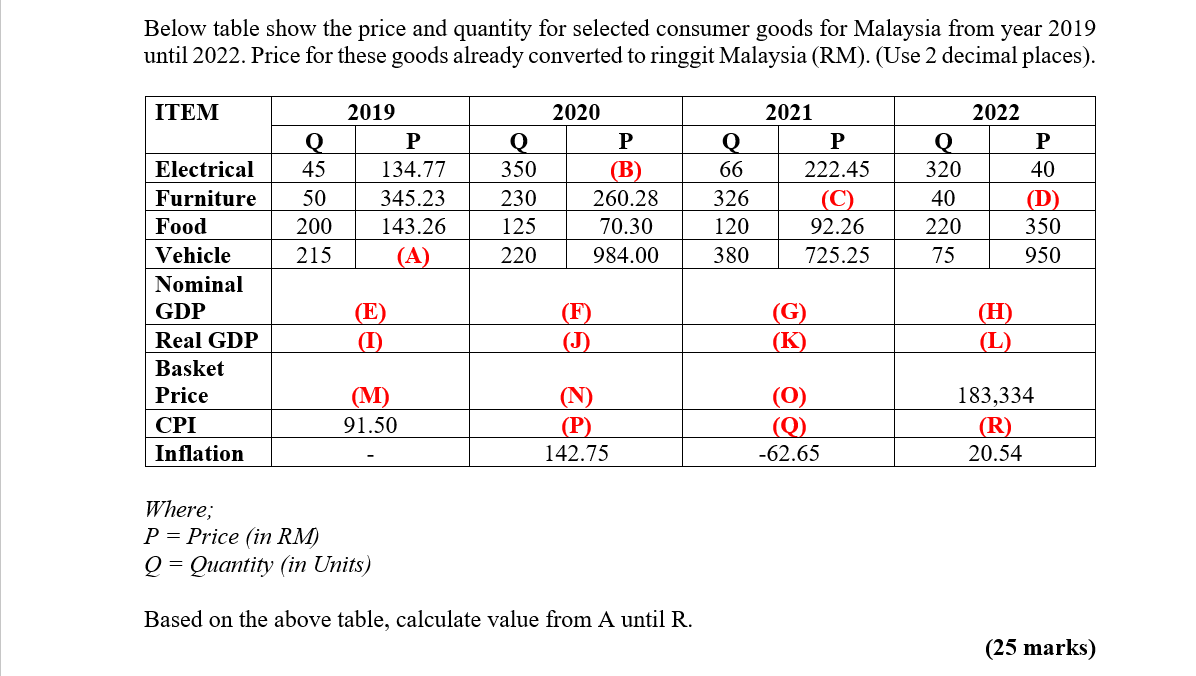
Question: Below table show the price and quantity for selected consumer goods for Malaysia from year 2 0 1 9 until 2 0 2 2 .
Below table show the price and quantity for selected consumer goods for Malaysia from year until Price for these goods already converted to ringgit Malaysia RMUse decimal places
tableITEMQPQPQPQPElectricalBFurnitureCDFoodVehicleAtableNominalGDPEFGHReal GDPIJKLtableBasketPriceMNOCPIPQRInflation
Where;
Price in
Quantity in Units
Based on the above table, calculate value from A until R
marks
Step by Step Solution
There are 3 Steps involved in it
1 Expert Approved Answer
Step: 1 Unlock

Question Has Been Solved by an Expert!
Get step-by-step solutions from verified subject matter experts
Step: 2 Unlock
Step: 3 Unlock