

Question: Below, the STATA computer output shows data from a study comparing FEV (forced expiratory volume in liters) in 11 nonsmoking teens with 8 teens who
Below, the STATA computer output shows data from a study comparing FEV (forced expiratory volume in liters) in 11 nonsmoking teens with 8 teens who reported some history of smoking. Subjects were selected via simple random sampling procedures.
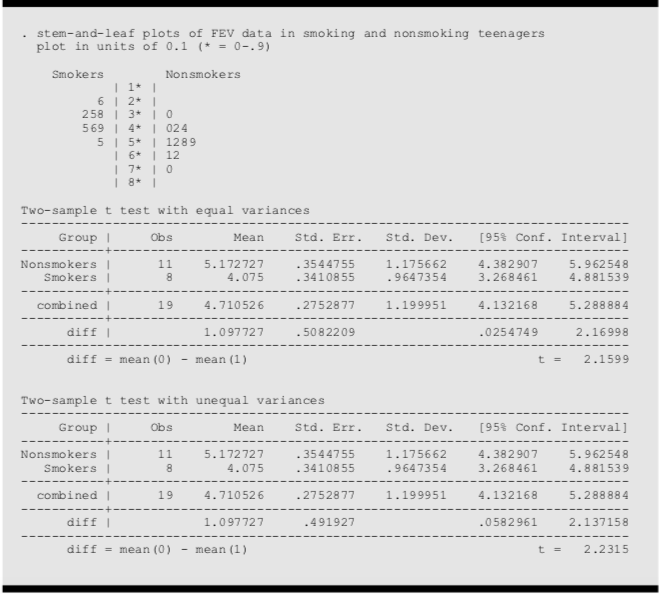
stem-and-leaf plots of FEV data in smoking and nonsmoking teenagers plot in units of 0.1 (* = 0-.9) Smokers Nonsmokers 1* 6 258 3# 0 569 4# 024 1289 12 0 Two-sample t test with equal variances Group Obs Mean Std. Err. Std. Dev. [95% Conf. Interval] Nonsmokers 11 5. 172727 . 354 4755 1 . 175662 4. 382907 5. 962548 Smokers 4. 075 . 3410855 . 9647354 3. 268461 4. 881539 combined 19 4. 710526 . 2752877 1. 199951 4. 132168 5. 288 884 diff 1. 097727 . 5082209 . 0254749 2. 16998 diff = mean (0) - mean (1) t = 2.1599 Two-sample t test with unequal variances Group Obs Mean Std. Err. Std. Dev. [95% Conf. Interval] Nonsmokers 11 5. 172727 . 354 4755 1 . 175662 4. 382907 5. 962548 Smokers 4. 075 3410855 . 9647354 3. 268461 4. 881539 combined 19 4. 710526 . 2752877 1. 199951 4. 132168 5. 288 884 diff 1. 097727 . 491927 . 0582961 2. 137158 diff = mean (0) - mean (1) t = 2.2315
Step by Step Solution
There are 3 Steps involved in it

Get step-by-step solutions from verified subject matter experts