

Question: Below you are given a control chart for a process. Identify the point(s) where you think the process have out-of-control data point(s) and why. Comment
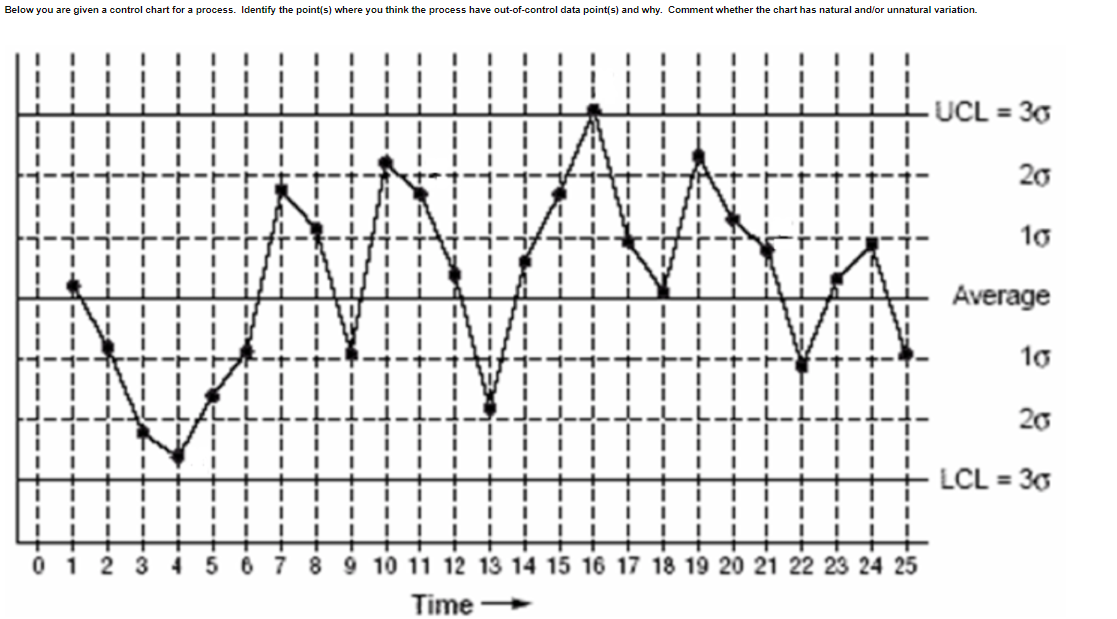
Below you are given a control chart for a process. Identify the point(s) where you think the process have out-of-control data point(s) and why. Comment whether the chart has natural and/or unnatural variation. UCL = 30 20 16 Average 10 20 LCL = 30 0 2 3 6 8 9 10 11 12 13 14 15 16 17 18 19 20 21 22 23 24 25 Time
Step by Step Solution
There are 3 Steps involved in it
1 Expert Approved Answer
Step: 1 Unlock

Question Has Been Solved by an Expert!
Get step-by-step solutions from verified subject matter experts
Step: 2 Unlock
Step: 3 Unlock