

Question: Below you are given a graph and the data that was used to generate it. The Forecast was made using a six week moving average.
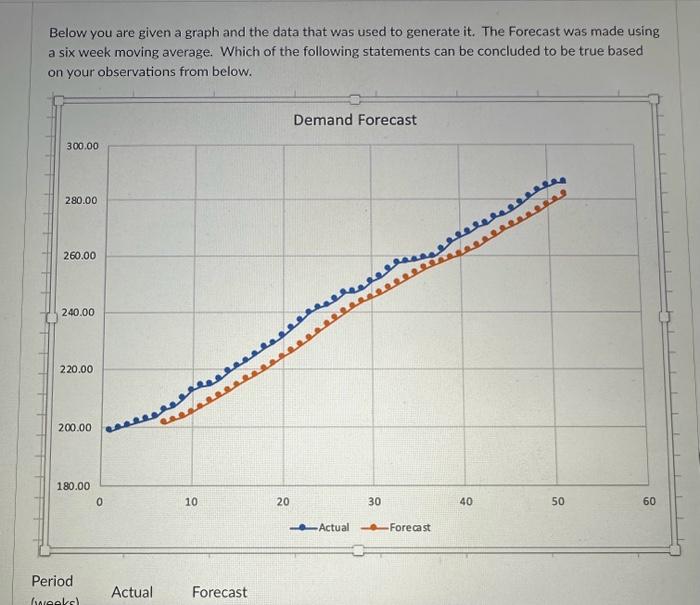
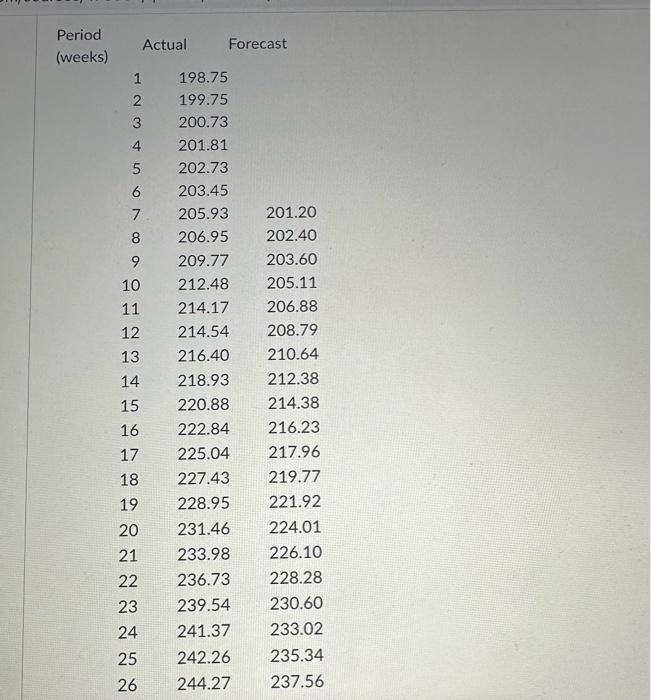
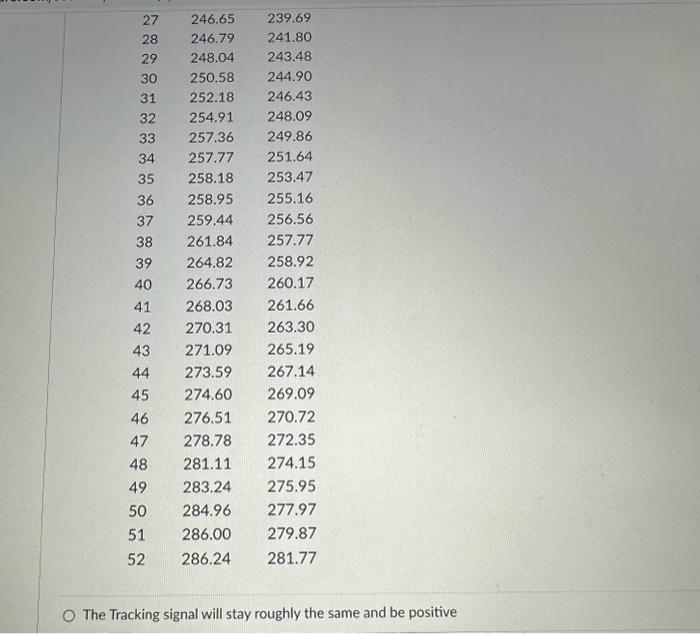
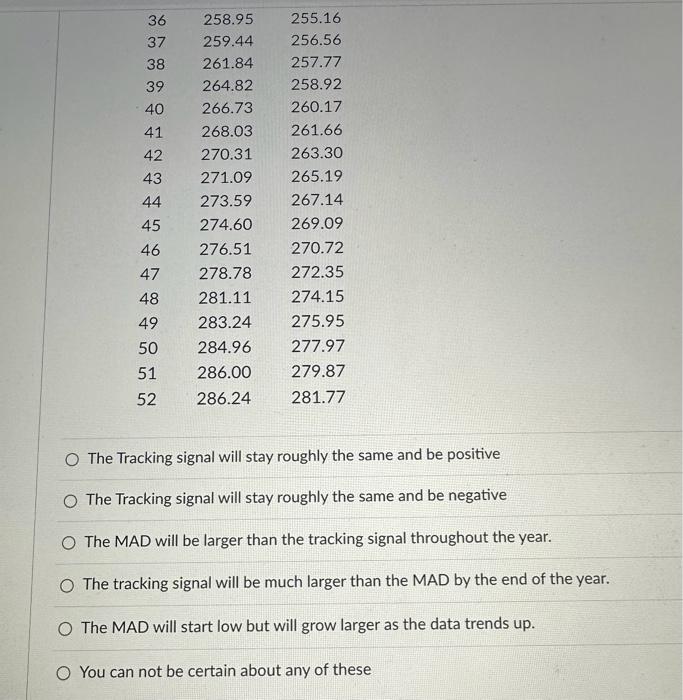
Below you are given a graph and the data that was used to generate it. The Forecast was made using a six week moving average. Which of the following statements can be concluded to be true based on vour nhservations from below. The Tracking signal will stay roughly the same and be positive The Tracking signal will stay roughly the same and be positive The Tracking signal will stay roughly the same and be negative The MAD will be larger than the tracking signal throughout the year. The tracking signal will be much larger than the MAD by the end of the year. The MAD will start low but will grow larger as the data trends up. You can not be certain about any of these
Step by Step Solution
There are 3 Steps involved in it

Get step-by-step solutions from verified subject matter experts