

Question: Below you see one image with its corresponding histogram. Gray scales were normalized between 0 and 1. Look-up tables (LUTA- LUTC) give three different gray
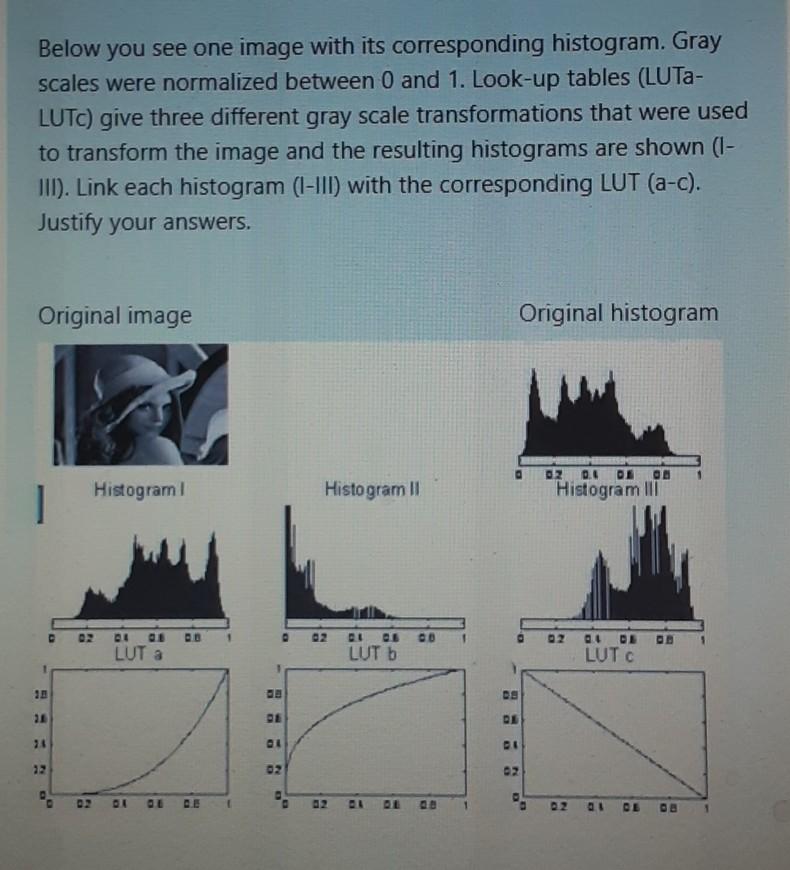
Below you see one image with its corresponding histogram. Gray scales were normalized between 0 and 1. Look-up tables (LUTA- LUTC) give three different gray scale transformations that were used to transform the image and the resulting histograms are shown (1- III). Link each histogram (I-III) with the corresponding LUT (a-c). Justify your answers. Original image Original histogram 02 0.6 Histogram! Histogram II DE OA Histogram III 01 01 . GO LUT a LUT b 2 DO LUTC 1 ta 21 1 10 22
Step by Step Solution
There are 3 Steps involved in it
1 Expert Approved Answer
Step: 1 Unlock

Question Has Been Solved by an Expert!
Get step-by-step solutions from verified subject matter experts
Step: 2 Unlock
Step: 3 Unlock