

Question: Below you see scatterplot (with the line of the best fit) for monthly returns on the stock of Bank of America (BAC) versus returns on
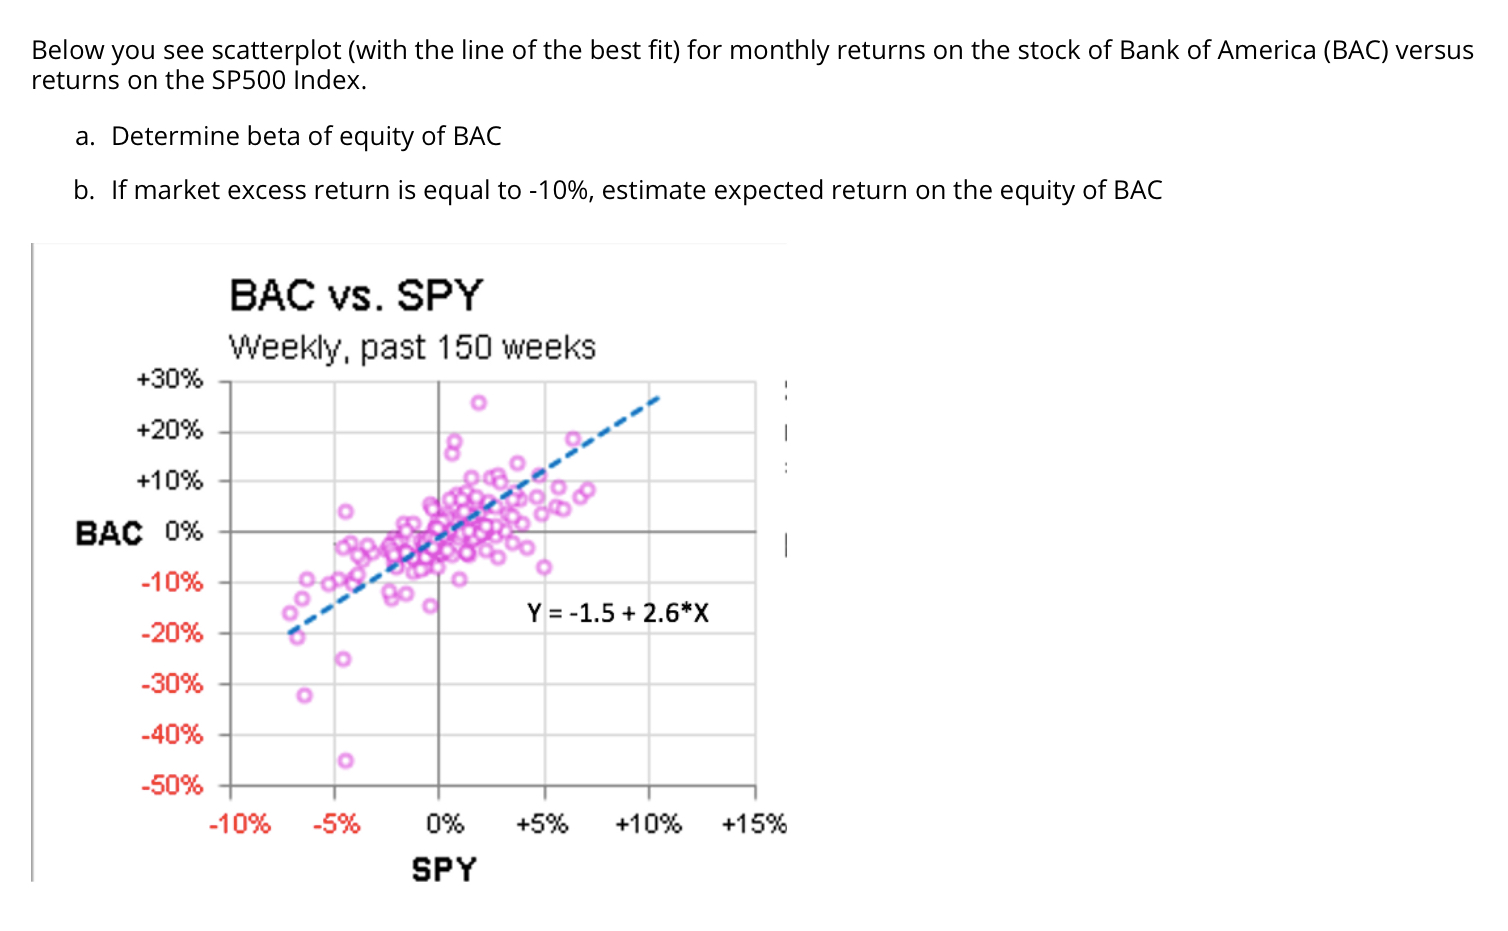
Below you see scatterplot (with the line of the best fit) for monthly returns on the stock of Bank of America (BAC) versus returns on the SP500 Index. a. Determine beta of equity of BAC b. If market excess return is equal to -10%, estimate expected return on the equity of BAC BAC VS. SPY Weekly. past 150 weeks +30% +20% +10% BAC 0% -10% | Y = -1.5 + 2.6*X -20% -30% -40% o -50% -10% -5% +5% +10% +15% 0% SPY
Step by Step Solution
There are 3 Steps involved in it
1 Expert Approved Answer
Step: 1 Unlock

Question Has Been Solved by an Expert!
Get step-by-step solutions from verified subject matter experts
Step: 2 Unlock
Step: 3 Unlock