

Question: Below you see scatterplot (with the line of the best fit) for monthly excess returns on the stock of Freeport-McMoran, Inc (FCX), versus excess returns
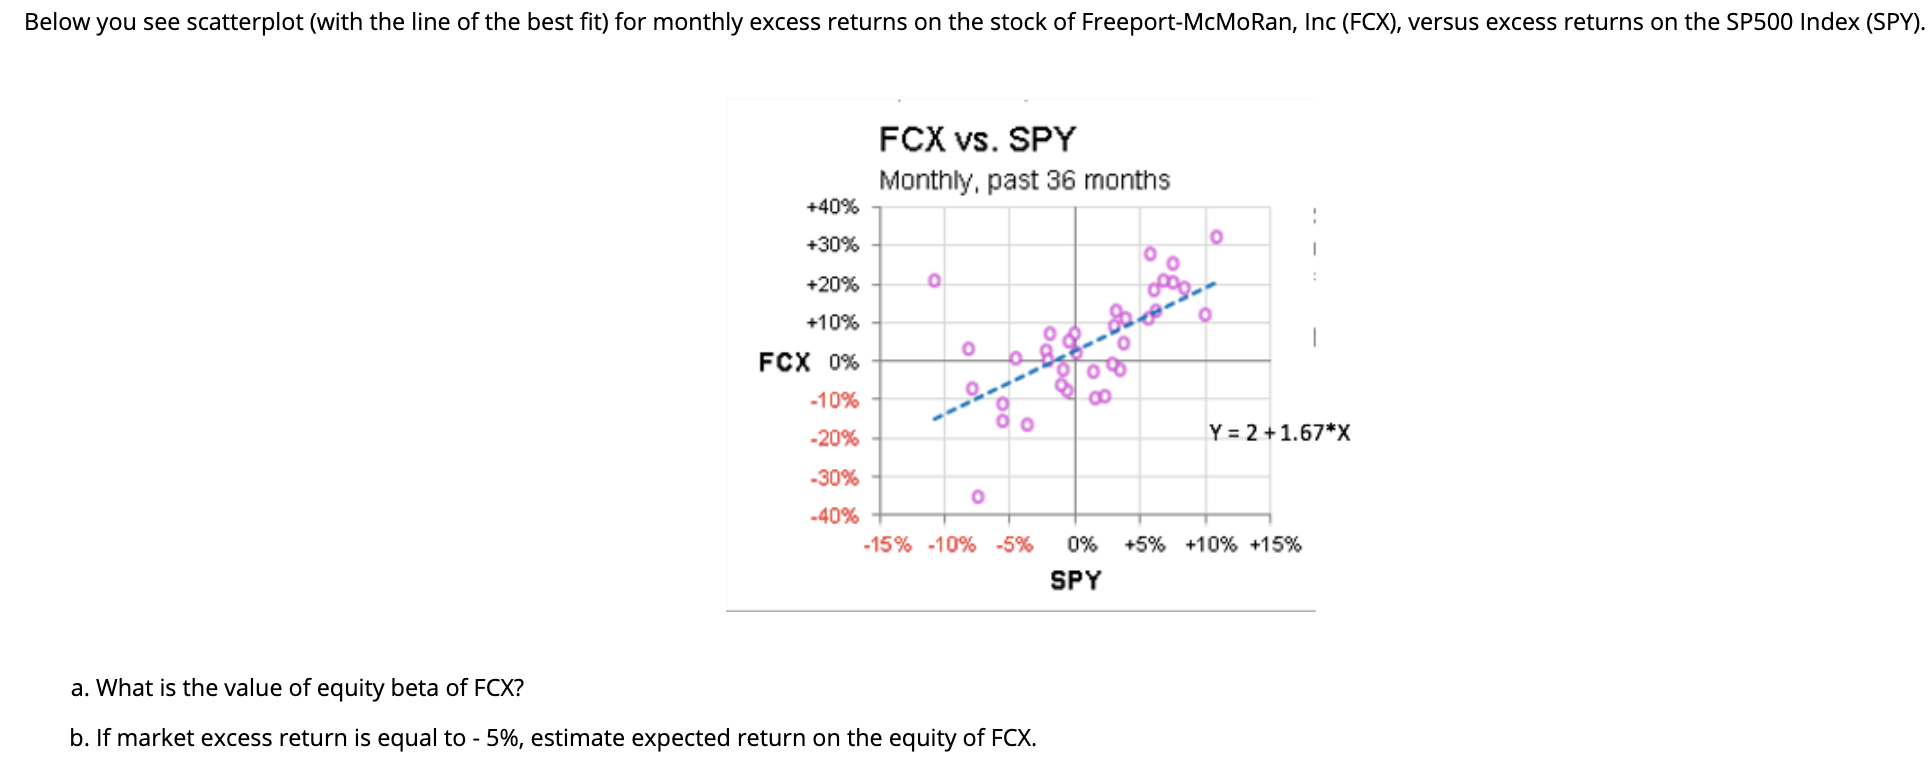
Below you see scatterplot (with the line of the best fit) for monthly excess returns on the stock of Freeport-McMoran, Inc (FCX), versus excess returns on the SP500 Index (SPY). FCX vs. SPY Monthly, past 36 months +40% +30% o o +20% o o +10% 2.00 O FCX 0% -10% 8 Oo -20% Y = 2 +1.67*X -30% O -40% -15% -10% -5% 0% +5% +10% +15% SPY a. What is the value of equity beta of FCX? b. If market excess return is equal to - 5%, estimate expected return on the equity of FCX
Step by Step Solution
There are 3 Steps involved in it
1 Expert Approved Answer
Step: 1 Unlock

Question Has Been Solved by an Expert!
Get step-by-step solutions from verified subject matter experts
Step: 2 Unlock
Step: 3 Unlock