

Question: best pic i can get Exhibit 10.13 - Factor for Determining 3-Sigma Limits for R-bar and x-bur Charts Number of Observations in Subgroup Factor for
best pic i can get 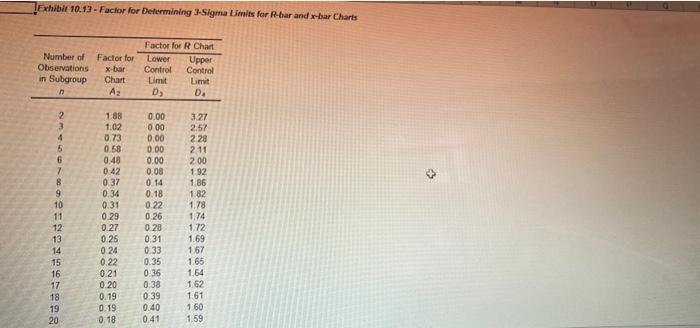
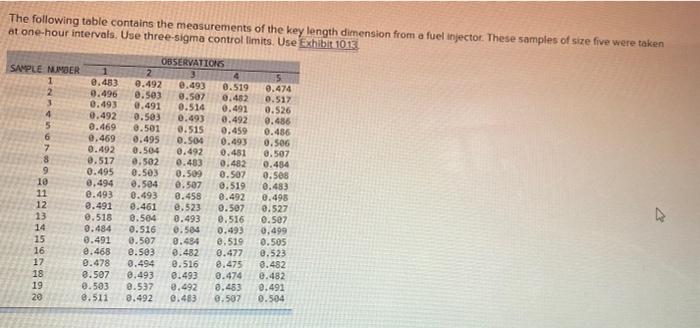
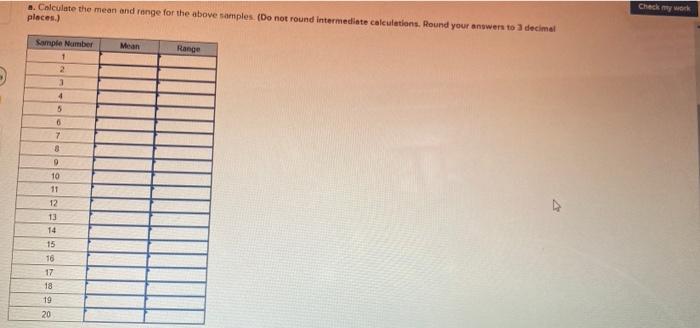
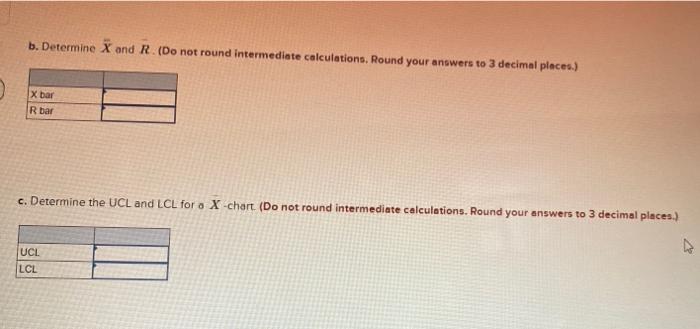
Exhibit 10.13 - Factor for Determining 3-Sigma Limits for R-bar and x-bur Charts Number of Observations in Subgroup Factor for x-bar Chart Az Factor for R Chart Lower Upper Control Control Limit Limit D D. 1.88 327 2.57 228 211 200 1.92 1 86 1.82 1.78 2 3 4 5 6 7 B 9 10 11 12 13 14 15 16 17 18 19 20 D=2p=BETB9% 1.74 0.00 0.00 0.00 0.00 0.00 0.08 0 14 0.18 0.22 0.26 0.28 0.31 0.33 0.35 0.36 0.38 0:39 0.40 041 1.02 0.73 0.58 0.40 0.42 0.37 0.34 0.31 0.29 0.27 0 25 0.24 0.22 0.21 0.20 0.19 0.19 0.18 1.72 1.69 167 1.65 1.64 1 62 161 1.60 1.59 The following table contains the measurements of the key length dimension from a fuel injector. These samples of size five were taken at one-hour intervals. Use three-sigma control limits. Use Exhibit 1013 SAMPLE NUMBER 1 2.483 2 0.496 3 0.493 4 0.492 5 2.469 6 0.469 7 0.492 8 8.517 9 0.495 10 2,494 11 0.493 12 2.491 13 0.518 14 3.484 15 8.491 16 8.468 17 8.478 18 8.507 19 0.503 20 8.511 OBSERVATIONS 2 0.492 0.493 0.519 0.503 0.507 0.482 0.491 0.514 0.491 8.503 0.493 0.492 0.501 0.515 0.459 0.495 0.504 0.493 0.504 0.492 0.481 2.582 0.483 0.482 0.503 0.509 3.507 8.584 0.507 0.519 0.493 8.458 0.492 2.461 8.523 3.507 8.504 0.493 2.516 8.516 0.584 0.493 8.507 0.484 2.519 0.583 8.482 3.477 3.494 0.516 8.475 0.493 0.493 0.474 8.537 0.492 2.483 0.492 6.483 0.507 5 0.474 0.517 0.526 0.486 0.486 0.506 8.507 0.484 0.508 0.483 0.498 0.527 0.507 0,499 0.505 0.523 8.482 0.482 2.491 0.504 - Calculate the mean and range for the above samples. (Do not found intermediate calculations. Round your answers to 3 decimal places.) Check my work Mean Range Sample Number 1 2 3 4 5 0 7 8 0 10 11 12 13 14 15 16 17 18 19 20 b. Determine X and R. (Do not round intermediate calculations. Round your answers to 3 decimal places.) X bar R bar c. Determine the UCL and LCL for a X-chart. (Do not round intermediate calculations. Round your answers to 3 decimal places.) UCL LCL d. Determine the UCL and LCL for R-chart (Leave no cells blank.be certain to enter "0" wherever required. Do not round intermediate calculations. Round your answers to 3 decimal places.) UCL LCL e. What comments can you make about the process? O Process is in statistical control Process is out of statistical control
Step by Step Solution
There are 3 Steps involved in it
1 Expert Approved Answer
Step: 1 Unlock

Question Has Been Solved by an Expert!
Get step-by-step solutions from verified subject matter experts
Step: 2 Unlock
Step: 3 Unlock