

Question: Beta Alpha .20 .30 t Data Forecast % error Smoothed 1.140.0 1.156.8 1.174.8 1,183.2 1,201.4 1,228.0 1.164 1,186 1,152 1,219 1,272 1.221 1,163 1,136 1,127
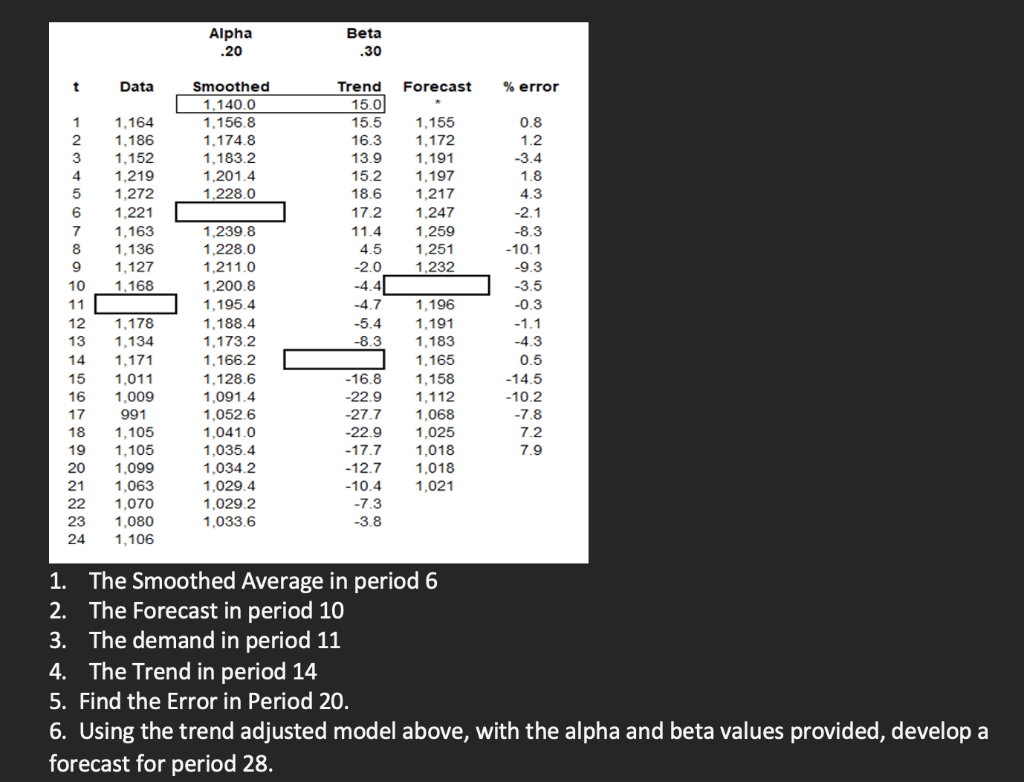
Beta Alpha .20 .30 t Data Forecast % error Smoothed 1.140.0 1.156.8 1.174.8 1,183.2 1,201.4 1,228.0 1.164 1,186 1,152 1,219 1,272 1.221 1,163 1,136 1,127 1,168 Trend 15.0 15.5 16.3 13.9 15.2 18.6 17.2 11.4 4.5 -2.0 -4.41 -4.7 -5.4 -8.3 1 2 3 4 5 6 7 8 9 10 11 12 13 14 15 16 17 18 19 20 21 22 23 24 1.155 1.172 1.191 1.197 1.217 1.247 1,259 1.251 1,232 0.8 1.2 -3.4 1.8 4.3 -2.1 -8.3 -10.1 -9.3 -3.5 -0.3 -1.1 -4.3 0.5 - 14.5 - 10.2 -7.8 7.2 7.9 1,239.8 1,228.0 1,211.0 1.200.8 1,195.4 1.188.4 1,173.2 1,166.2 1,128.6 1,091.4 1,052.6 1,041.0 1,035.4 1,034.2 1,029.4 1,029.2 1,033.6 1,178 1,134 1,171 1.011 1,009 991 1,105 1,105 1,099 1,063 1,070 1,080 1,106 -16.8 -22.9 -27.7 -22.9 - 17.7 -12.7 - 10.4 -7.3 -3.8 1,196 1,191 1,183 1,165 1,158 1,112 1,068 1,025 1,018 1,018 1,021 1. The Smoothed Average in period 6 2. The Forecast in period 10 3. The demand in period 11 4. The Trend in period 14 5. Find the Error in Period 20. 6. Using the trend adjusted model above, with the alpha and beta values provided, develop a forecast for period 28. Beta Alpha .20 .30 t Data Forecast % error Smoothed 1.140.0 1.156.8 1.174.8 1,183.2 1,201.4 1,228.0 1.164 1,186 1,152 1,219 1,272 1.221 1,163 1,136 1,127 1,168 Trend 15.0 15.5 16.3 13.9 15.2 18.6 17.2 11.4 4.5 -2.0 -4.41 -4.7 -5.4 -8.3 1 2 3 4 5 6 7 8 9 10 11 12 13 14 15 16 17 18 19 20 21 22 23 24 1.155 1.172 1.191 1.197 1.217 1.247 1,259 1.251 1,232 0.8 1.2 -3.4 1.8 4.3 -2.1 -8.3 -10.1 -9.3 -3.5 -0.3 -1.1 -4.3 0.5 - 14.5 - 10.2 -7.8 7.2 7.9 1,239.8 1,228.0 1,211.0 1.200.8 1,195.4 1.188.4 1,173.2 1,166.2 1,128.6 1,091.4 1,052.6 1,041.0 1,035.4 1,034.2 1,029.4 1,029.2 1,033.6 1,178 1,134 1,171 1.011 1,009 991 1,105 1,105 1,099 1,063 1,070 1,080 1,106 -16.8 -22.9 -27.7 -22.9 - 17.7 -12.7 - 10.4 -7.3 -3.8 1,196 1,191 1,183 1,165 1,158 1,112 1,068 1,025 1,018 1,018 1,021 1. The Smoothed Average in period 6 2. The Forecast in period 10 3. The demand in period 11 4. The Trend in period 14 5. Find the Error in Period 20. 6. Using the trend adjusted model above, with the alpha and beta values provided, develop a forecast for period 28
Step by Step Solution
There are 3 Steps involved in it

Get step-by-step solutions from verified subject matter experts