

Question: Question 3 58.5 Average global temperature 1880-2013 58.0 $ 57.5 57.0 56.5 1880 1900 1920 1940 1960 1980 2000 2020 Year The graph above
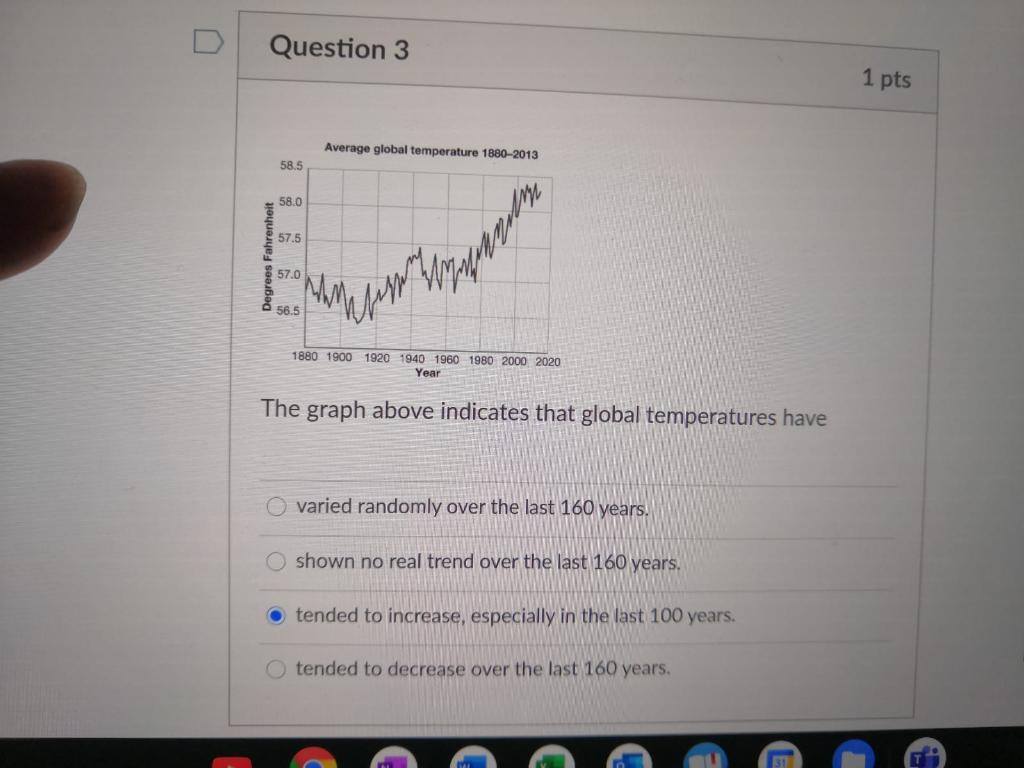
Question 3 58.5 Average global temperature 1880-2013 58.0 $ 57.5 57.0 56.5 1880 1900 1920 1940 1960 1980 2000 2020 Year The graph above indicates that global temperatures have Ovaried randomly over the last 160 years. shown no real trend over the last 160 years. tended to increase, especially in the last 100 years. Otended to decrease over the last 160 years. 1 pts
Step by Step Solution
There are 3 Steps involved in it
1 Expert Approved Answer
Step: 1 Unlock

To determine the average temperature trend between 1880 and 1930 we must refer to historical climate ... View full answer
Question Has Been Solved by an Expert!
Get step-by-step solutions from verified subject matter experts
Step: 2 Unlock
Step: 3 Unlock