Question: B.Foundation (40 points) You are given information from the Foundation FastTrack F116900-R6 pp.3-8 in a separate handout. Use the information given to answer the following
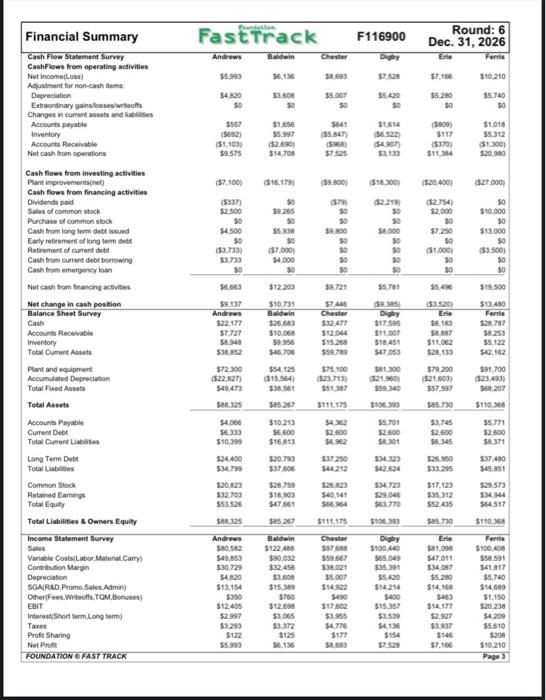
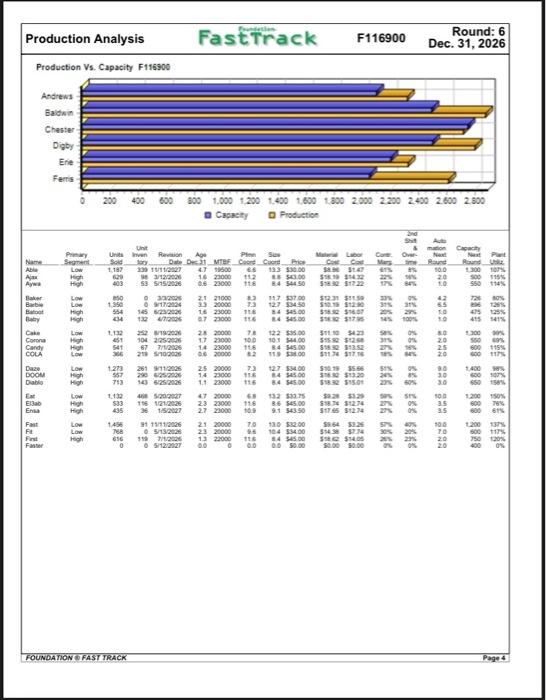
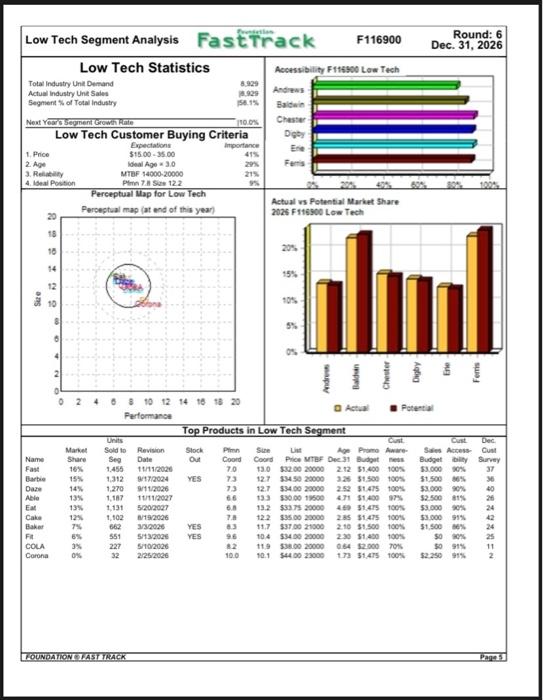
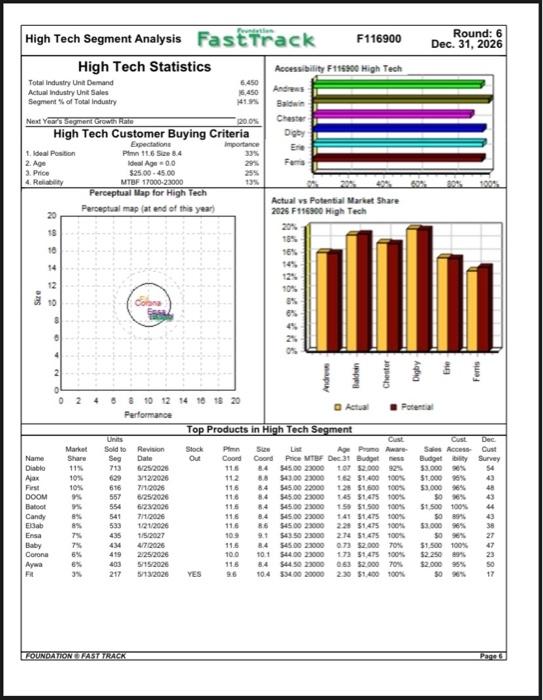
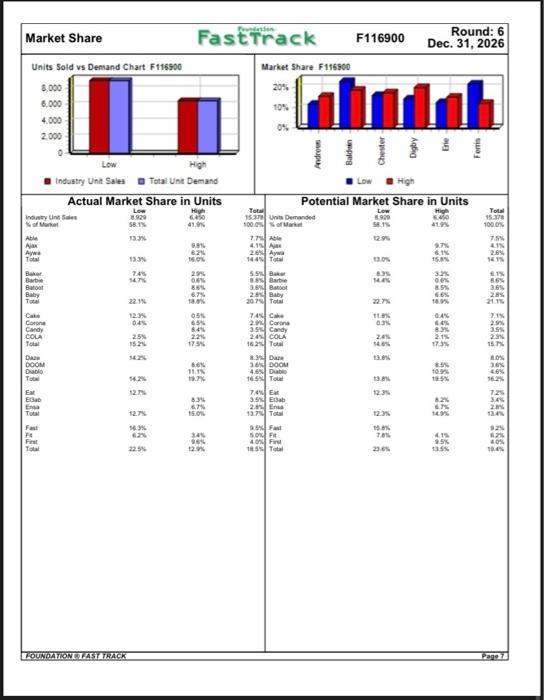
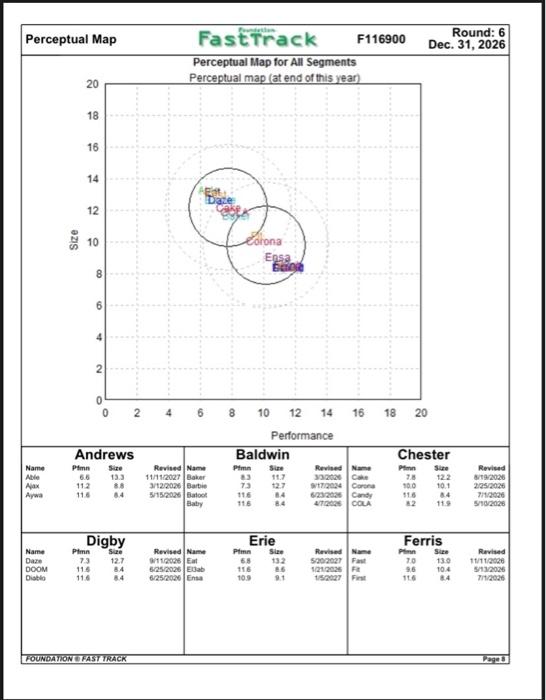
B.Foundation (40 points) You are given information from the Foundation FastTrack F116900-R6 pp.3-8 in a separate handout. Use the information given to answer the following questions. Always explain the reasons and justification for your answer, show in detail all calculations you made and walk me through your rationale so that you show me you understand. Answer as if you are explaining to a student who does not have background about what you are explaining. 6. Explain Digby's overall competitive strategy and that for each of its products? Justify your answer using information from the Foundation FastTrack provided on the functional decisions that Digby has adopted for each product for the following three functional departments (R&D, marketing and production). Please feel free to criticize any functional decision that doesn't match the competitive strategy. After you have done this, please draw your final conclusion (15 points) 7. Compare the leverage ratio and the capital structure of the two companies ANDREWS and BALDWIN. Comment on the result and give recommendations for improvement (if needed) for both companies. Which one in your opinion is better and why? (5 points). 8. Which company is using its assets more efficiently to generate sales while which one is using its assets efficiently to generate profit? Justify your answers by calculating the appropriate ratios to measure both. Is it the same company or not? If not why do you think this happened? (10 Points) 9. Below is a snapshot of a historical income statement of the six companies in Round 3. Please comment in details showing your calculations on the change that BALDWIN has been able to make in its profitability indicators by comparing its current performance (i.e. the current round) to its performance in round 3. Why do you think their taxes were negative in Rd.3 (10 Points) Financial Summary Cash Flow Statement Survey CashFlows from operating activities Net Income(Loss) Adjustment for non-cash items: Depreciation Extraordinary gainstosses/woffs Changes in current assets and liables Accounts payable Inventory Accounts Receivable Net cash from operations Cash flows from investing activities Plant improvements(net) Cash flows from financing activities Dividends paid Sales of common stock Purchase of common stock Cash from long term debt issued Early retirement of long term dett Retirement of current debt Cash from current debt borrowing Cash from emergency loan Net cash from financing activities Net change in cash position Balance Sheet Survey Cash Accounts Receivable Inventory Total Cument Assets Plant and equipment Accumulated Depreciation Total Fixed Assets Total Assets Accounts Payable Current Debt Total Current Liables Long Term Debt Total Liables Common Stock Retained Earings Total Equity Total Liabilities & Owners Equity Income Statement Survey Sales Variable Costs(Labor Material Carry) Contribution Margin Depreciation SGAIR&D Promo, Sales Admin) Other Fees Writeoffs.TOM.Bonuses) EBIT Interest Short term Long term) Taxes Profit Sharing Net Prof FOUNDATION FAST TRACK Fast Track F116900 Andrews Baldwin Digby $5.993 56,136 $7.528 $4,820 $5,420 50 50 50 $557 $1.656 $1,614 $5.997 (36.522) ($1,103) ($2.090) ($4.907) $9.575 $14,708 $3,133 ($7.100) ($16,179) ($18,300) ($337) 50 ($2.219) $2.500 $9.265 50 50 50 $4.500 $5.938 $4.000 50 50 50 ($3.733) ($7.000) 50 $3.733 $4,000 50 50 50 $6.663 $12.203 $9.721 $6,781 $9.137 $10,731 $7.446 (39.385) Andrews Baldwin Chester $22,177 $26.643 $32.477 $17.505 $7,727 $10.068 $12,044 $11.007 $8.948 $9.956 $15,260 $18.451 $36,852 $46,706 $59.789 $47,053 $72.300 $54,125 $75.100 $81.300 ($22,827) ($15.564) (523,713) ($21,960) $49,473 $38.561 $59.340 $86.325 $85.267 $111.175 $106.393 $4,066 $10.213 $4,362 $5,701 $6.333 $6.600 $2.600 $2,600 $10.399 $16.813 $6.962 $8.301 $24,400 $20,793 $37.250 $34.323 $34,799 $37,606 $44.212 $42.624 $20,823 $28,759 $26.823 $34.723 $32.703 $18.903 $40.141 $29.046 $53,526 $47.661 $66.964 $63,770 $86,325 $85.267 $111.175 $106.393 Andrews Baldwin Chester $80.582 $122,488 $97.688 $100,440 $49,853 $90.032 $59.667 $65.049 $30,729 $32.456 $38.021 $35.391 $4,820 $3.606 $5.007 $5,420 $13,154 $15,389 $14.922 $14,214 $350 $760 $400 $12,405 $12.696 $17.602 $15.357 $2.997 $3,065 $3,955 $3,539 $3.293 $3.372 $4.776 $4,136 $125 $154 56.136 $122 $5.993 Chester $8.693 $5,007 50 5641 ($5.847) (1968) $7.525 ($9.800) (579) 50 $9,800 50 50 50 $177 Round: 6 Dec. 31, 2026 Erie Ferris $7,166 $10,210 $5,280 $5,740 $0 50 ($800) $1,018 $117 $5,312 ($370) ($1,300) $11,384 $20,980 ($20,400) ($27.000) ($2.754) 50 $2.000 $10.000 $0 50 $7.250 50 $13,000 $0 ($3,500) ($1,000) 50 $0 50 50 $5,496 $19.500 ($3.520) $13,480 Erie Ferris $8.183 $29,787 $8,867 $8.253 $11,062 $5,122 $28,133 $42.162 $79,200 $91,700 ($21,603) ($23,493) $57,507 $68,207 $85.730 $110.368 $3,745 $5,771 $2,600 $2,600 $6.345 $8.371 $26.950 $37,480 $45.851 $17,123 $29,573 $35.312 $34.944 $52,435 $64,517 $85.730 $110.368 Erie Forris $81,098 $100,408 $47,011 $58,591 $34.087 $41,817 $5.290 $5,740 $14,168 $14,689 $463 $1,150 $14,177 $20,238 $2,927 $4,209 $3.937 $5,610 $146 $208 $7.166 $10,210 Page 3 Fast Track F116900 Round: 6 Dec. 31, 2026 0 200 400 600 800 1.000 1.200 1.400 1.600 1.800 2.000 2.200 2400 2600 2.500 Capacity Production Sht Unit Units Inven Revision Age Sold Jory Care Over Next &mation Round 10.0 Capacity Next Plet Round U 1.300 Name Able Segment Low High 1,187 339 15/11/2027 Ma Labor Cost Cost $8.00 $1.47 51819314.22 18.32 $17.22 Date Dec 31 MTBE Coord 47 19500 1623000 0.6 23000 107% Ajax 629 66 112 116 3/12/200 41% 22% N% 17% 84% 500 115% 550 114% Aywa High 403 53 5/15/2006 1.0 Baker LOW eso 42 80% 21 21000 33 20000 7.3 Barbie Low 1,350 65 896 126% 0 332026 09/17/2024 145 6232026 132 4/7/2006 $12.31 $11.59 $10.19 $12.90 $16.32 $16.07 $16:30 $17.95 31% 20% Batoot High 554 1.0 475 125% 16 23000 11.6 8.7 23000 11.6 Baby High 434 54% 415 541% Cake Low 1.132 252 8/19/2006 8.0 30% 28 20000 17 23000 Corona 20 560 89% 451 541 104 225-2006 67 7/1/2026 78 100 14 23000 11.8 06 20000 $11.10 $4.23 $15.32 $12.68 $18.32 $13.52 $11.34 $17,16 315 27% Candy High 600 115% COLA Low 306 219 5/102026 600 117% Daze Low 1.273 261 9/11/2006 25 20000 9.0 1.400 18% DOOM 51% 24% High 557 73 11.6 116 $10.19 $566 $16.30 $13.20 $18.32 $15.01 290 6/25/2006 143 6/25/2026 600 107% 14 23000 1.1 23000 Diablo High 713 650 158% Eat Low 1.132 10.0 1.200 150% 47 20000 2.3 23000 El3ab High 468 5202027 116 1/21/2026 36 1/5/2027 533 68 11.6 27 23000 109 58.28 $3.29 $18.74 $12.74 $17.45 $12.74 59% ses 27% 0% 27% 3.5 600 76% 600 61% Ensa High 435 35 Fast Low 10.0 Low Fit First Faster 91 11/11/2026 768 05/13/2006 616 119 7/1/2006 0 05/12/2027 21 20000 7.0 23 20000 9.5 1.3 22000 116 0 $14.38 37.74 $182 $14.05 1.200 137% 600 117% 750 120% 0% High FOUNDATION FAST TRACK Page 4 Production Analysis Production Vs. Capacity F116900 Andrews Baldwin Chester Digby Erie Ferris Suv Core Price 133 $30.00 $43.00 8.4 544.50 11.7 $37.00 127 $34.50 8.4 $45.00 8.4 $45.00 122 $35.00 10.1 $44.00 8.4 $45.00 11.9 $36.00 127 $34.00 84 $45.00 8.4 $45.00 132 $33.75 8.6 $45.00 9.1 543.50 130 $32.00 104 $34.00 8.4 $45.00 1.300 Low Tech Segment Analysis FastTrack Low Tech Statistics Total Industry Unit Demand Actual Industry Unit Sales 8.929 8.929 Segment % of Total Industry 156.1% Next Year's Segment Growth Rate 10.0% Low Tech Customer Buying Criteria Expectations Importance 1. Price $15.00-35.00 Ideal Age 3.0 2. Age 29% 3. Reliability MTBF 14000-20000 21% 4. Ideal Position Pin 7.8 Size 12.2 9% Perceptual Map for Low Tech Perceptual map (at end of this year) 20 10 14 Size Round: 6 Dec. 31, 2026 dud 5% 0% 6 8 10 12 14 16 18 20 Performance Top Products in Low Tech Segment Cust Cust Dec Units Sold to Revision Pimn Size Stock Out Seg Date 11/11/2026 1,455 1,312 9/17/2024 YES 1,270 9/11/2026 13 List Age Promo Aware- Coord Coord Price MTBF Dec 31 Budget ness 7.0 13.0 $32.00 20000 2.12 $1,400 100% 73 12.7 $34.50 20000 326 $1.500 100% 12.7 $34.00 20000 2.52 $1.475 100% 13.3 $30.00 19600 4.71 $1,400 97% 469 51.475 100% 285 $1.475 100% 2.10 $1,500 100% 2.30 $1,400 100% 0.64 $2.000 70% 1.73 $1,475 100% Sales Access Cust Budget blity Survey $3.000 90% 37 $1.500 80% 36 $3.000 40 $2.500 81% 26 $3.000 90% 24 $3.000 91% 42 $1,500 86% 1,187 11/11/2027 1,131 5/20/2027 66 6.8 7.8 8.3 1,102 8/19/2026 662 3/3/2026 YES 24 13.2 $33.75 20000 12.2 $35.00 20000 11.7 $37.00 21000 96 10.4 $34.00 20000 11.9 $38.00 20000 10.1 $44.00 23000 551 5/13/2026 YES 50 90% 25 11 227 5/10/2026 82 50 91% $2.250 91% 32 2/25/2006 10.0 Market Name Share Fast 16% Barbie 15% Daze 14% Able 13% Eat 13% Cake 12% Baker 7% Fit 3% COLA Corona 0% FOUNDATION FAST TRACK F116900 Accessibility F116900 Low Tech Andrews Baldwin Chester Digby Ferris Actual vs Potential Market Share 2026 F116900 Low Tech 2 Page 5 High Tech Segment Analysis FastTrack High Tech Statistics 6,450 Total Industry Unit Demand Actual Industry Unit Sales Segment % of Total Industry 16,450 141.9% Next Year's Segment Growth Rate 20.0% High Tech Customer Buying Criteria Expectations Importance 1. Ideal Position Pimn 11.6 Size 8.4 33% Ideal Age -0.0 29% 2. Age 3. Price $25.00-45.00 25% 4. Reliability MTBF 17000-23000 13% Perceptual Map for High Tech Perceptual map (at end of this year) ang & 22122 20 18 14 F116900 Accessibility F116900 High Tech Andrews Baldwin Chester Digby Ere Ferris Actual vs Potential Market Share 2026 F116900 High Tech 20% 18% 16% 14% 12% 10% 8% 6% 2% Top Products in High Tech Segment Stock Out 0 2 6 8 10 12 14 16 18 20 Performance Units Market Sold to Revision Share Seg Date Name Diablo 11% 713 6/25/2026 Ajax 10% 629 3/12/2026 First 10% 616 7/1/2026 DOOM 9% 557 6/25/2026 Batoot 9% 554 6/23/2026 Candy 541 7/1/2026 El3ab 8% Ensa 533 1/21/2026 435 1/5/2027 434 4/7/2026 Baby 7% Corona 6% 6% Aywa FR 419 2/25/2026 403 5/15/2026 217 5/13/2026 YES 3% FOUNDATION FAST TRACK Cust 11.6 11.6 11.6 Pin Size Age Promo Aware- Coord Coord Price MTBF Dec 31 Budget ness 11.6 8.4 $45.00 23000 1.07 $2.000 92% 11.2 8.8 $43.00 23000 162 $1,400 100% 8.4 $45.00 22000 128 $1,600 100% 8.4 $45.00 23000 1.45 $1,475 100% 84 $45.00 23000 1.59 $1.500 100% 8.4 $45.00 23000 1.41 $1,475 100% 86 $45.00 23000 2.29 $1,475 100% 9.1 $43.50 23000 2.74 $1.475 100% 8.4 $45.00 23000 0.73 $2.000 70% 10.1 $44.00 23000 1.73 $1,475 100% 8.4 $44.50 23000 0.63 $2.000 70% 10.4 $34.00 20000 2.30 $1,400 100% 11.6 11.6 10.9 11.6. 10.0 11.6 96 Agbig Round: 6 Dec. 31, 2026 Cust Sales Access Budget blity $3.000 96% $1.000 95% $3,000 96% 50 96% $1,500 100% 50 89% $3.000 96% 50 96% $1,500 100% $2.250 89% $2.000 95% 50 96% Dec Cust Survey 54 48 43 44 43 38 27 ********* 23 50 17 Page 6 Market Share Units Sold vs Demand Chart F116900 8,000 6.000 4.000 2,000 Low High Industry Unit Sales Total Unit Demand Actual Market Share in Units High Low 8.929 58.1% 6,450 41.9% 13.3% 98% 62% 13.3% 16.0% 7.4% 14.7% 22.1% 12.3% Industry Unt Sales of Market Ajax Aywa Total Baker Barbie Batoot Baby Total Cake Corone Candy COLA Total Da DOOM Diablo Total Eat Elab Ensa Total Fast FA First Total FOUNDATION & FAST TRACK FastTrack 0.4% 2.5% 15.2% 12.7% 12.7% 16.3% 6.2% 22.5% 2.9% 06% 86% 6.7% 18.8% 0.5% 6.5% 8.4% 2.2% 17.3% 6.6% 11.1% 19.7% 8.3% 67% 15.0% 34% 94% 12.9% Market Share F116900 20%- 10% 0% Andres Baldwin Chester F116900 Tota 15.37 Units Demanded 100.0% of Market 7.7% Able 4.1% Aj 26% Awa 144% Total 55% Bak 8% Barbie 3.6% Batoot 28% Baby 20.7% Total 74% Cake 29 Carina 35% Candy 24% COLA 16.2% Total 8.3% Da 36% DOOM 4.6% Diabl 16.5% To 7.4% E 3.5% Eb 2. Ena 13.7% Total 9.5% Fast 50% F 40% Fi 18.5% Total Round: 6 Dec. 31, 2026 Ich Low High Potential Market Share in Units High Low 8.929 450 58.15 12.95 13.0% 83% 14.4% 11.8% 0.3% 24% 14.6% 13.8% 12.3% 15.8% 78% 23.6% Aqba 41.9% 9.7% 6.1% 15.8% 32% 00% 8.5% 6.6% 0.4% 6.4% 8.3% 2.1% 17.3% 8.5% 10.9% 18.5% 8.2% 6.7% 4.1% 9.5% 13.5% Total 15.378 100.0% 4.1% 2.8% 14.1% 6.1% 8.6% 3.6% 2.8% 21.11% 7.1% 2.9% 3.5% 2.3% 15.7% 8.0% 30% 4.6% 16.2% 72% 34% 28% 92% 4.2% 40% 10.4% Page 7 Perceptual Map 20 18 16 14 12 10 Size 8 9 Pimn 2 0 0 2 Andrews Pimn Size 6.6 11.2 11.6 Name Able 13.3 Ajax 8.8 Aywa 8.4 Digby Name Size Daze 73 12.7 DOOM 11.6 84 Diablo 11.6 84 FOUNDATION FAST TRACK Fast Track Perceptual Map for All Segments Perceptual map (at end of this year) Corona Revised Name 11/11/2027 Baker 3/12/2026 Barbie 5/15/2026 Batoot Baby Revised Name 9/11/2026 Eat 6/25/2026 Elab 6/25/2026 Ensa 8 Ensa Bo 10 12 14 Performance Baldwin Pimn Size 83 11.7 73 12.7 11.6 84 116 8.4 Erie Pimn 6.8 116 10.9 Size 132 8.6 9.1 F116900 16 18 20 Revised Name 332026 Cake 9/17/2024 Corona 6/23/2026 Candy 4/7/2026 COLA Revised Name 520/2027 Fast 1/21/2026 Fa 1/52027 First Round: 6 Dec. 31, 2026 Chester Pimn Size 7.8 12.2 10.0 10.1 11.6 82 Ferris Pinn Size 1.0 9.6 11.6 8.4 11.9 13.0 10.4 8.4 Revised 8/19/2026 2/25/2026 7/1/2026 5/10/2026 Revised 11/11/2020 5/13/2026 7/1/2026 Page 8