

Question: Big exam coming can you help with prep? 2 Chapter 14 Financial Ratios and Firm Performance Walmart Inc. Abbreviated Income Statements for the Years Ending
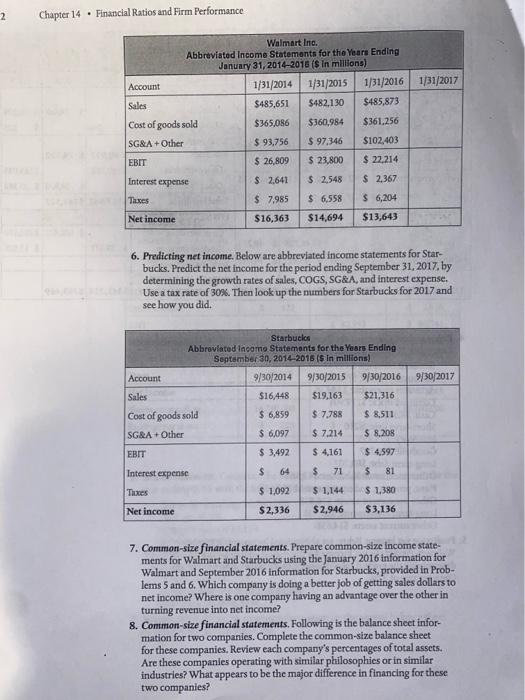
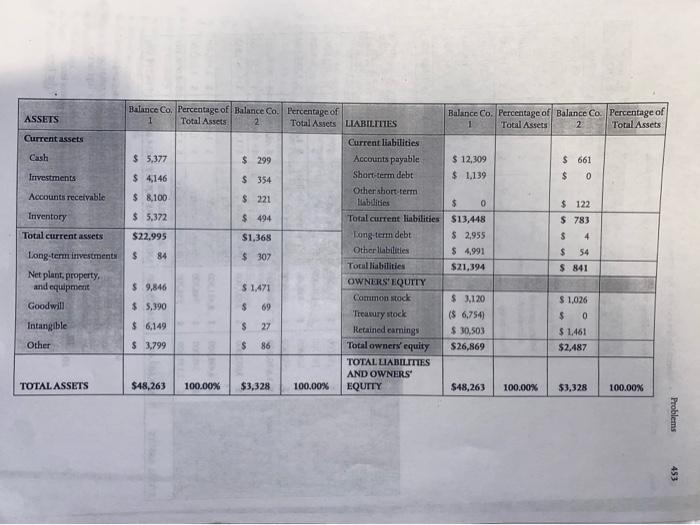
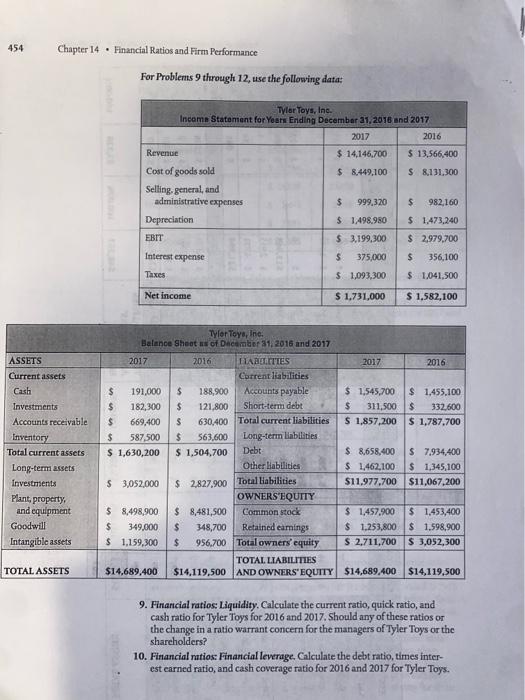
2 Chapter 14 Financial Ratios and Firm Performance Walmart Inc. Abbreviated Income Statements for the Years Ending January 31, 2014-2015 ($ in millions) Account 1/31/2014 1/31/2015 1/31/2016 Sales $485,651 $482,130 $485,873 Cost of goods sold $365,086 $360,984 $361,256 SG&A + Other $ 93,756 $ 97,346 $102,403 EBIT $ 26,809 $ 23,800 $ 22,214 Interest expense $ 2,641 $ 2,548 $ 2,367 Taxes $ 7,985 $6,558 $ 6,204 Net income $16,363 $14,694 $13,643 6. Predicting net income. Below are abbreviated income statements for Star- bucks. Predict the net income for the period ending September 31, 2017, by determining the growth rates of sales, COGS, SG&A, and interest expense. Use a tax rate of 30%. Then look up the numbers for Starbucks for 2017 and see how you did. Starbucks Abbreviated Income Statements for the Years Ending September 30, 2014-2015 (S in millions) Account 9/30/2014 9/30/2015 9/30/2016 9/30/2017 Sales $16,448 $19,163 $21,316 Cost of goods sold $ 6,859 $7,788 $ 8,511 SG&A+Other $ 6,097 $ 7,214 $ 8,208 EBIT $ 3,492 $ 4,161 $4,597 Interest expense $ 64 $ 71 $ 81 Taxes $ 1,092 $ 1,144 $ 1,380 Net income $2,336 $2,946 $3,136 7. Common-size financial statements. Prepare common-size income state- ments for Walmart and Starbucks using the January 2016 information for Walmart and September 2016 information for Starbucks, provided in Prob- lems 5 and 6. Which company is doing a better job of getting sales dollars to net income? Where is one company having an advantage over the other in turning revenue into net income? 8. Common-size financial statements. Following is the balance sheet infor- mation for two companies. Complete the common-size balance sheet for these companies. Review each company's percentages of total assets. Are these companies operating with similar philosophies or in similar industries? What appears to be the major difference in financing for these two companies? 1/31/2017 ASSETS Current assets Cash Investments Accounts receivable Inventory Total current assets Long-term investments Net plant, property, and equipment Goodwill Intangible Other TOTAL ASSETS Balance Co. Percentage of Balance Co. Percentage of 1 2 Total Assets Total Assets. $ 5,377 $ 299 $ 4,146 $ 354 $ 8,100 $ 221 $ 5,372 $ 494 $22.995 $1,368 $ 84 $ 307 $ 9,846 $ 1,471 $ 5,390 $ 69 $ 6,149 $ 27 $ 3,799 $ 86 $48,263 100.00% $3,328 100.00% LIABILITIES Current liabilities Accounts payable Short-term debt Other short-term Habilities Total current liabilities Long-term debt Other liabilities Total liabilities OWNERS' EQUITY Common stock Treasury stock Retained earnings Total owners' equity TOTAL LIABILITIES AND OWNERS EQUITY Balance Co. Percentage of Balance Co. Percentage of 1 Total Assets 2 Total Assets $ 12,309 $ 661 $ 1,139 $ 0 $0 $ 122 $13,448 $ 783 $ 2,955 $ 4 $ 4,991 $ 54 $21,394 $ 841 $ 3,120 $ 1,026 ($ 6,754) $0 $ 30,503 $ 1,461 $26,869 $2,487 $48,263 100.00% $3,328 100.00% Problems 453 454 Chapter 14 Financial Ratios and Firm Performance ASSETS Current assets Cash Investments Accounts receivable Inventory Total current assets Long-term assets Investments Plant, property, and equipment Goodwill Intangible assets TOTAL ASSETS For Problems 9 through 12, use the following data: Tyler Toys, Inc. Income Statement for Years Ending December 31, 2016 and 2017 2017 2016 Revenue $ 14,146,700 $ 13,566,400 Cost of goods sold $ 8,449,100 $ 8,131,300 Selling, general, and $ 999,320 $ 982,160 Depreciation $ 1,498,980 $ 1,473,240 EBIT $ 3,199,300 $ 2,979,700 Interest expense $ 375,000 $ 356,100 Taxes $ 1,093,300 $ 1,041,500 Net income $ 1,731,000 $ 1,582,100 Tyler Toys, Inc. Balance Sheet as of December 31, 2016 and 2017 2017 2016 FLABILITIES 2017 2016 Current liabilities $ 191,000 $ $ 1,545,700 $ 1,455,100 Accounts payable Short-term debt $ 188,900 182,300 $ 121,800 669,400 S 630,400 $ 587,500 $ 563,600 $ 1,630,200 $ 1,504,700 $ 311,500 $ 332,600 $ 1,857,200 $ 1,787,700 $ Total current liabilities Long-term liabilities Debt Other liabilities $ 8,658,400 $ 7,934,400 $ 1,462,100 $ 1,345,100 $11,977,700 $11,067,200 $ 3,052,000 $ 2,827,900 Total liabilities $ 8,498,900 $8,481,500 OWNERS'EQUITY Common stock Retained earnings $ 1,457,900 $ 1,453,400 $ 1,253,800 $ 1,598,900 $ 349,000 $ 348,700 $ 1,159,300 $ 956,700 Total owners' equity $ 2,711,700 $ 3,052,300 TOTAL LIABILITIES $14,689,400 $14,119,500 AND OWNERS' EQUITY $14,689,400 $14,119,500 9. Financial ratios: Liquidity. Calculate the current ratio, quick ratio, and cash ratio for Tyler Toys for 2016 and 2017. Should any of these ratios or the change in a ratio warrant concern for the managers of Tyler Toys or the shareholders? 10. Financial ratios: Financial leverage. Calculate the debt ratio, times inter- est earned ratio, and cash coverage ratio for 2016 and 2017 for Tyler Toys. administrative expenses
Step by Step Solution
There are 3 Steps involved in it

Get step-by-step solutions from verified subject matter experts