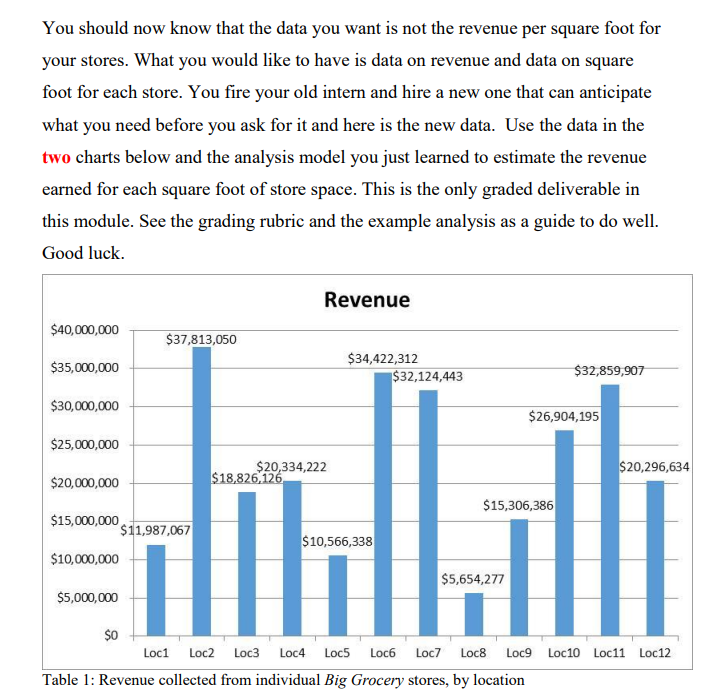
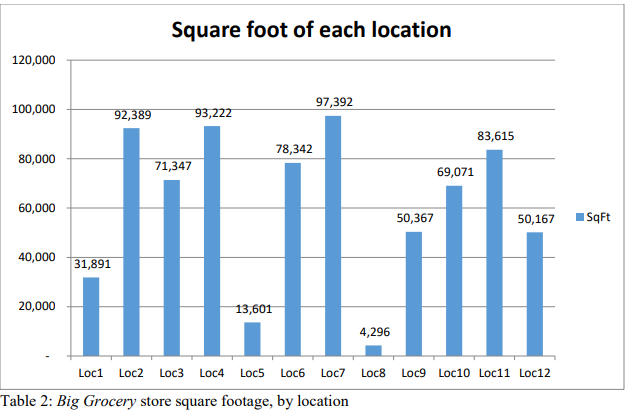
Question: Big grocery simple linear regression analysis You should now know that the data you want is not the revenue per square foot for your stores.

Big grocery simple linear regression analysis

Big grocery simple linear regression analysis YouBig grocery simple linear regression analysis You

You should now know that the data you want is not the revenue per square foot for your stores. What you would like to have is data on revenue and data on square foot for each store. You fire your old intern and hire a new one that can anticipate what you need before you ask for it and here is the new data. Use the data in the two charts below and the analysis model you just learned to estimate the revenue earned for each square foot of store space. This is the only graded deliverable in this module. See the grading rubric and the example analysis as a guide to do well. Good luck. Revenue $40,000,000 $37,813,050 $35,000,000 $34,422,312 $32,124,443 $32,859,907 $30,000,000 $26,904,195 $25,000,000 $20,334,222 $18,826,126 $20,296,634 $20,000,000 $15,306,386 $15,000,000 $11,987,067 $10,000,000 $10,566,338 $5,654,277 $5,000,000 $0 Loc1 Loc2 Loc3 Loc4 Loc5 Loc6 Loc7 Loc8 Loc9 Loc 10 Loc11 Loc12 Table 1: Revenue collected from individual Big Grocery stores, by location Square foot of each location 120,000 100,000 97,392 92,389 93,222 83,615 78,342 80,000 71,347 69,071 60,000 50,367 50,167 SqFt 40,000 31,891 20,000 13,601 4,296 Loc5 Loch Loc8 Loc9 Loc10 Loc11 Loc12 Loc1 Loc2 Loc3 Loch Loc7 Table 2: Big Grocery store square footage, by location

Step by Step Solution

There are 3 Steps involved in it

1 Expert Approved Answer
Step: 1 Unlock blur-text-image
Question Has Been Solved by an Expert!

Get step-by-step solutions from verified subject matter experts

Step: 2 Unlock
Step: 3 Unlock

Students Have Also Explored These Related General Management Questions!