Question: BIOL 260 Assignment 2b Analyze data and answer the 10 questions below. Embed your answers in this document (add space as needed) and turn in
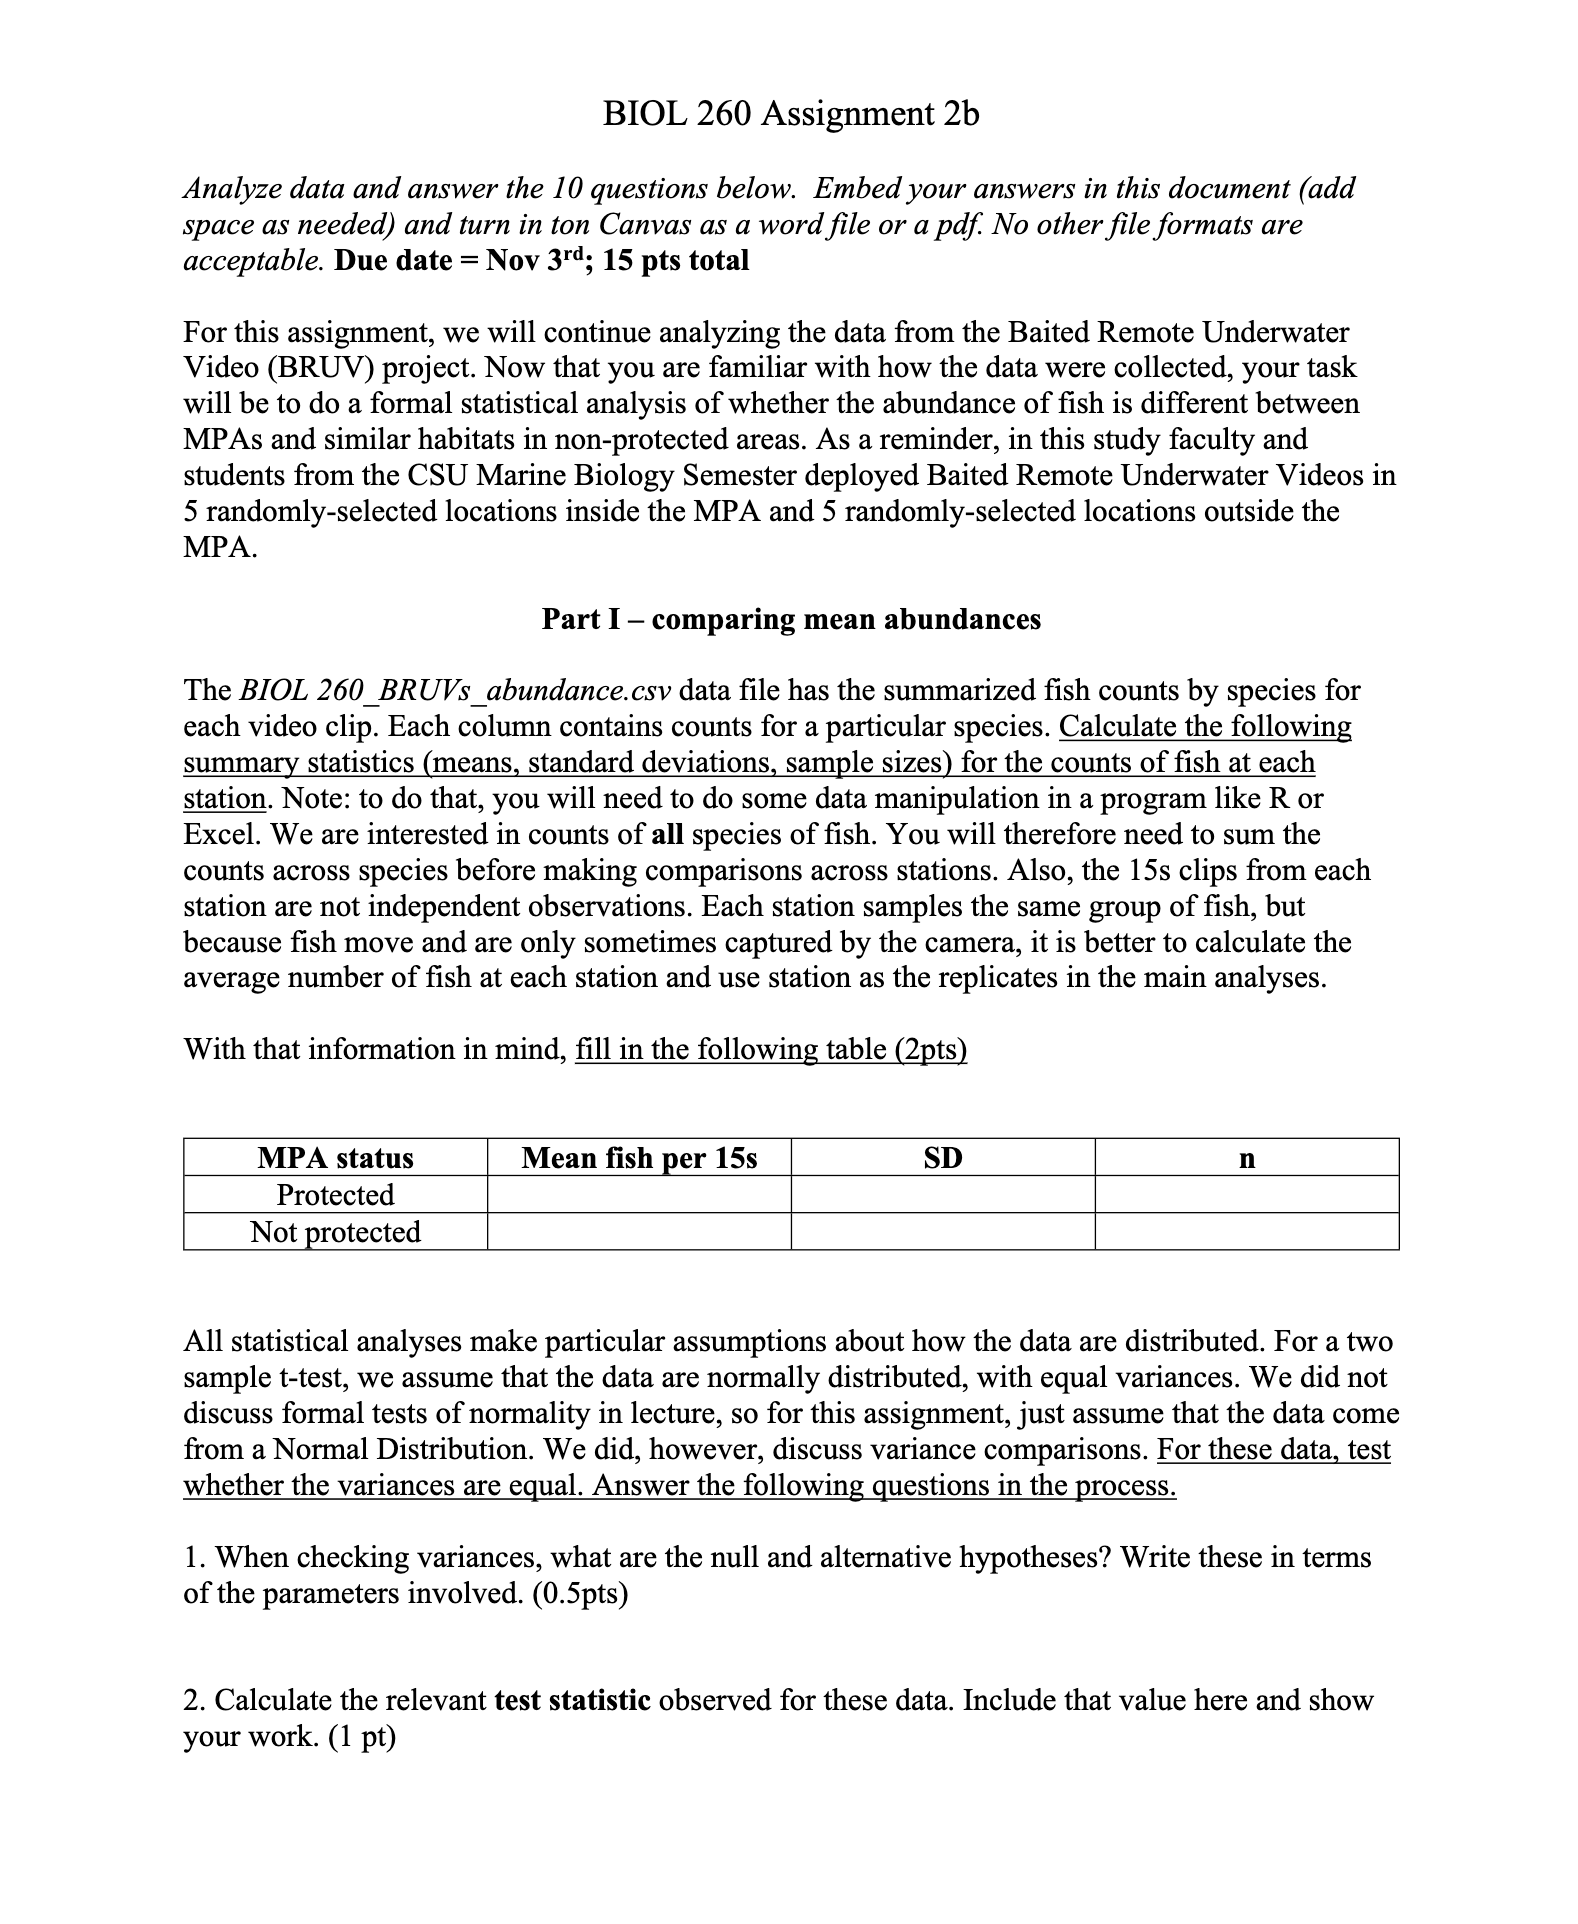
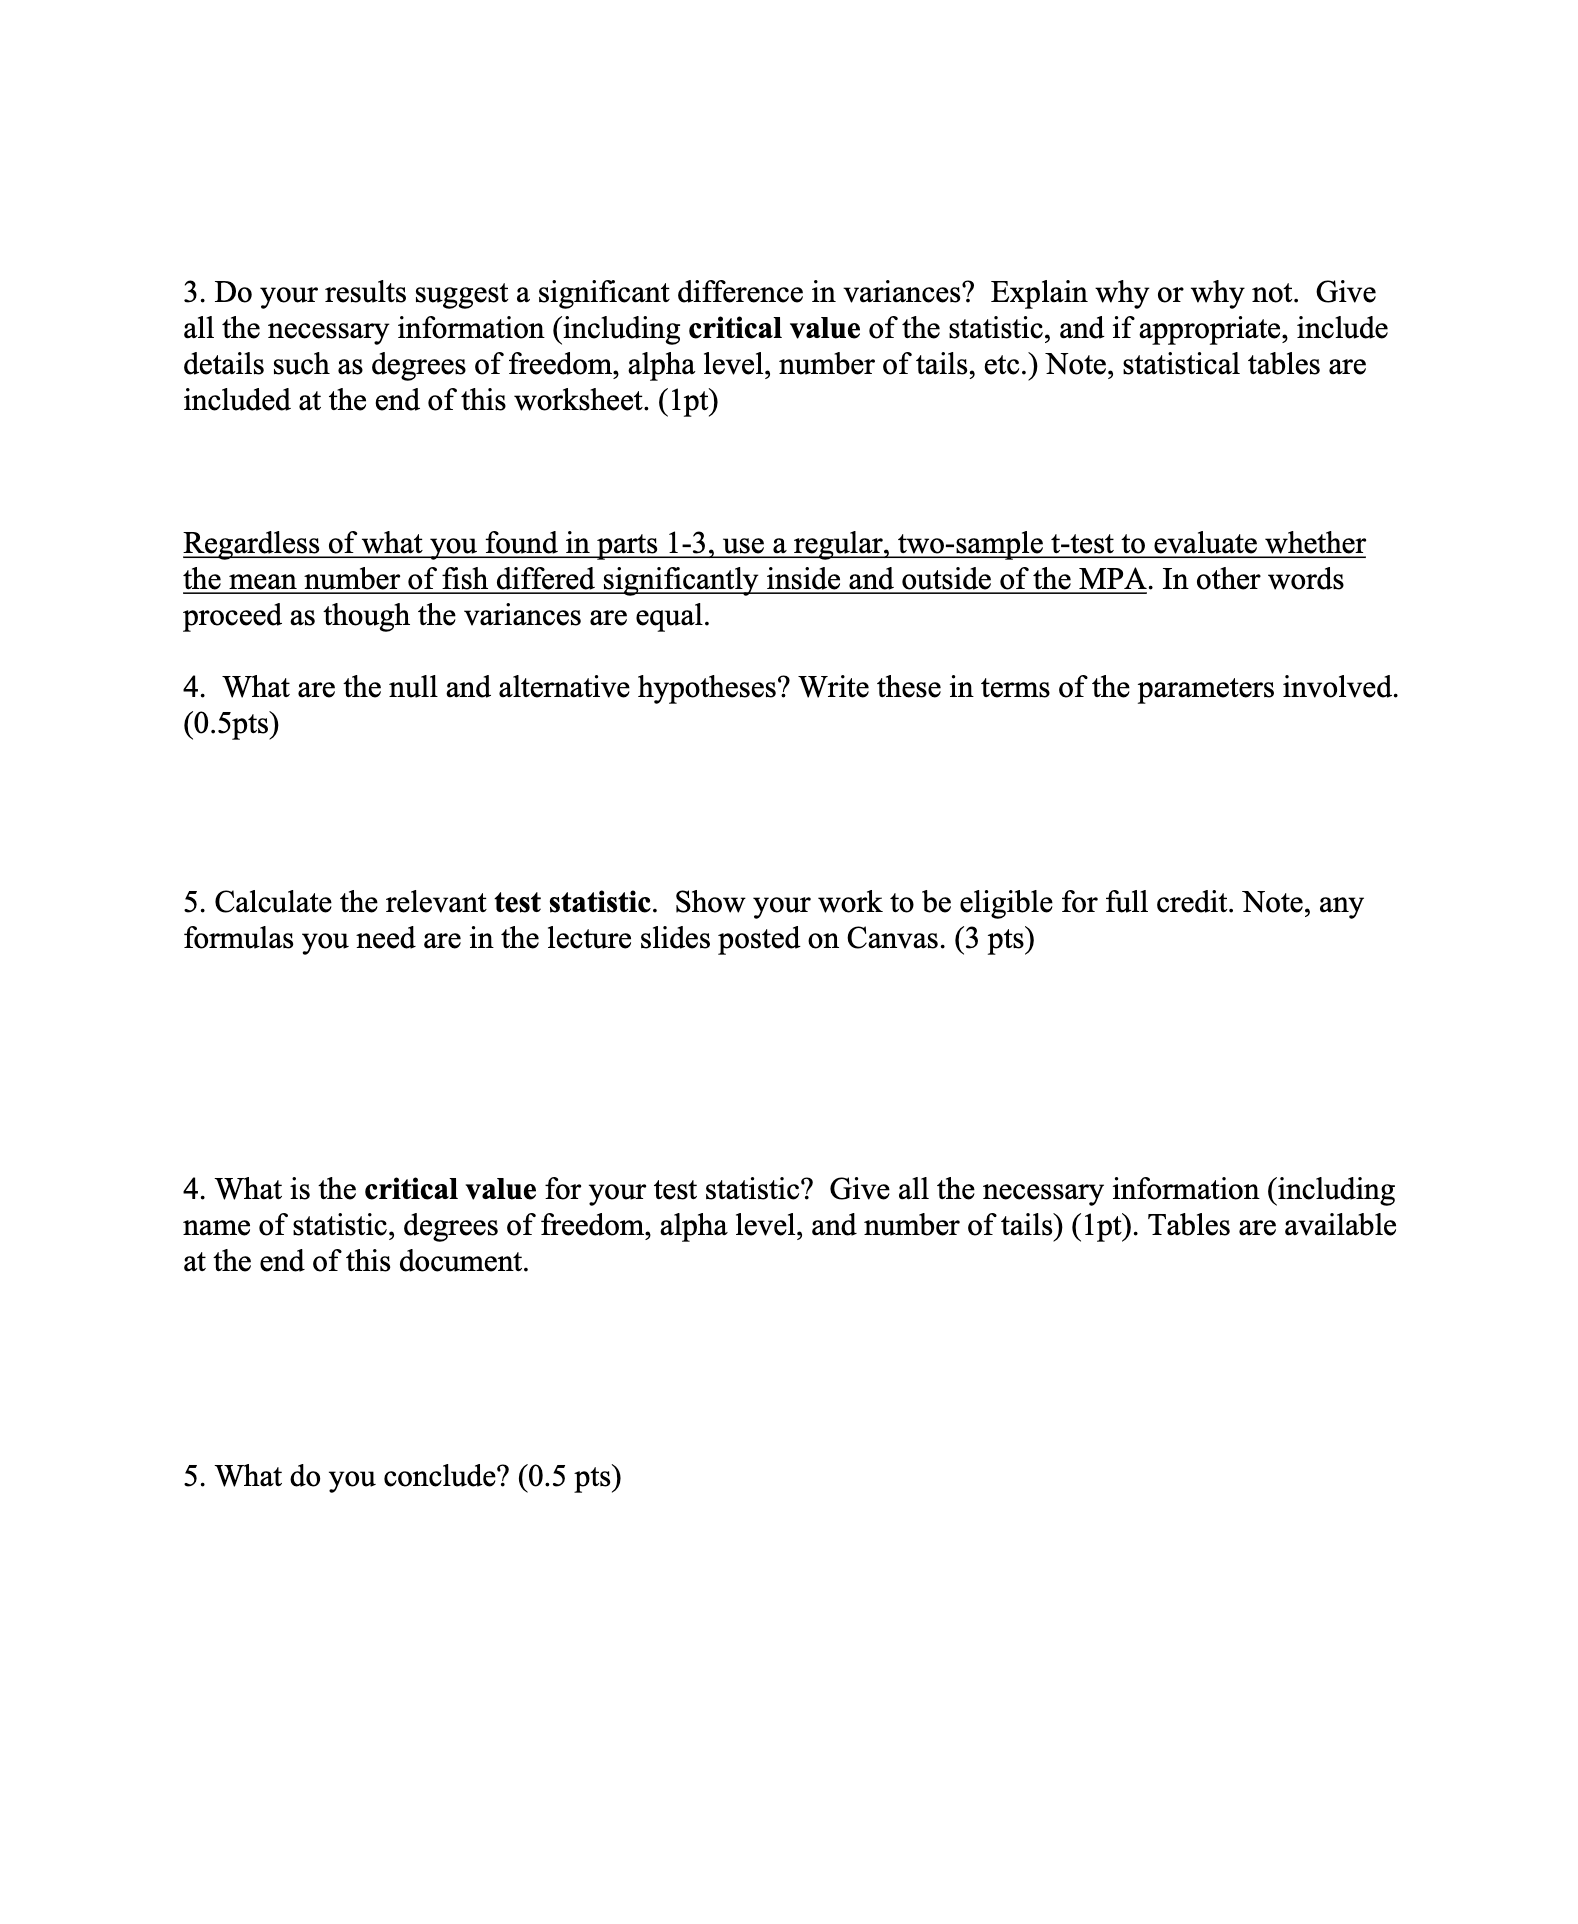
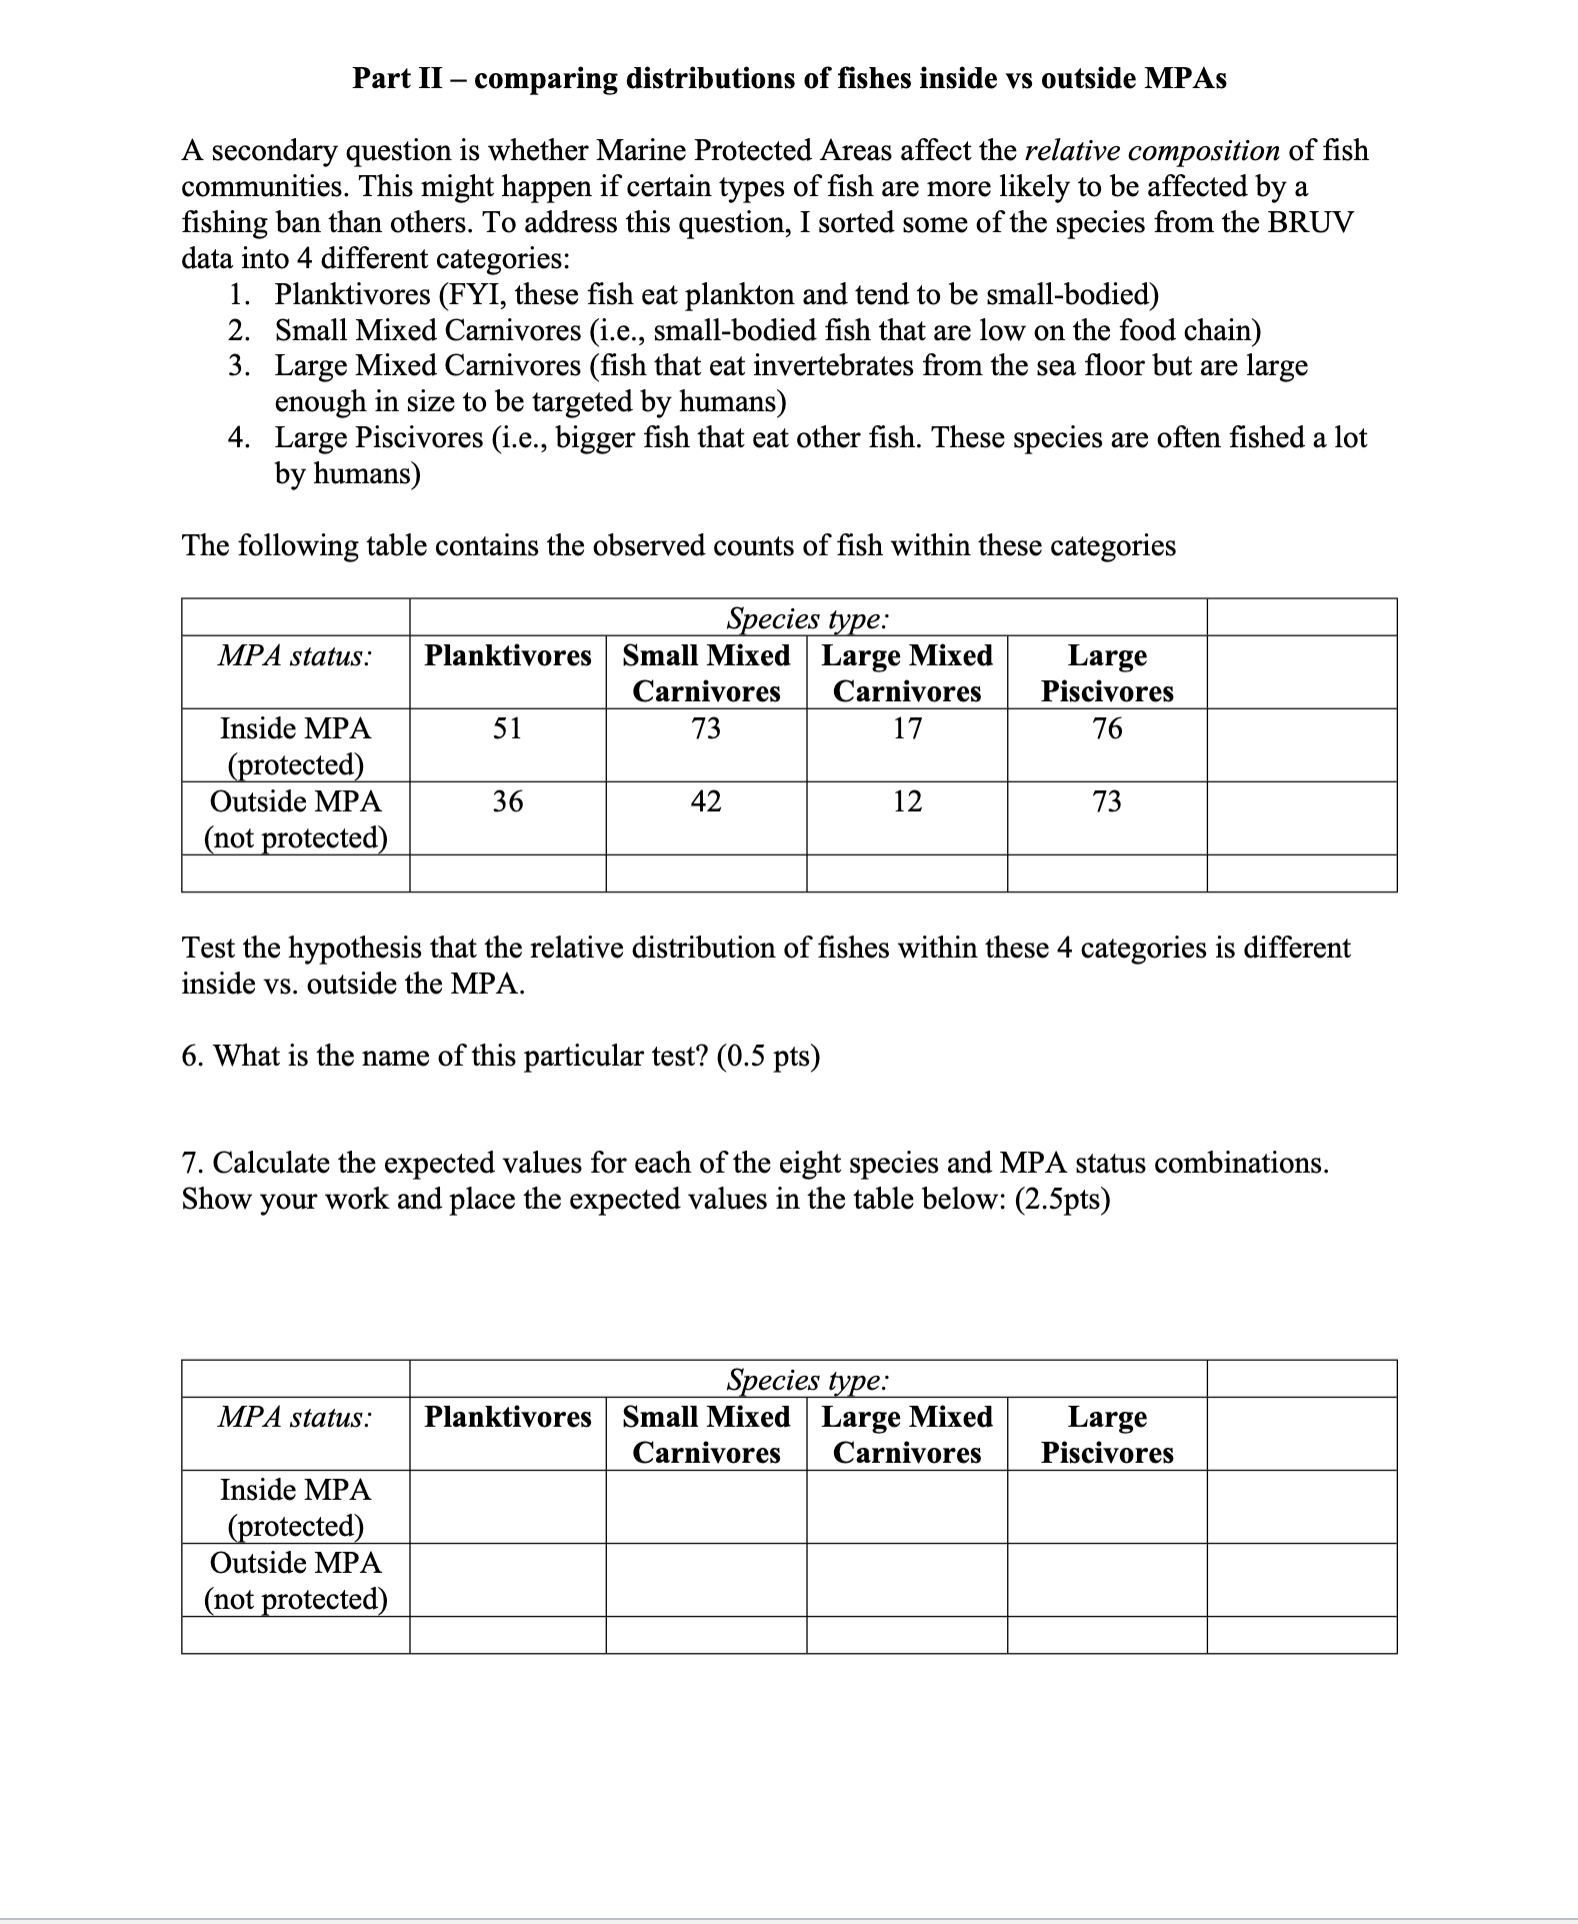
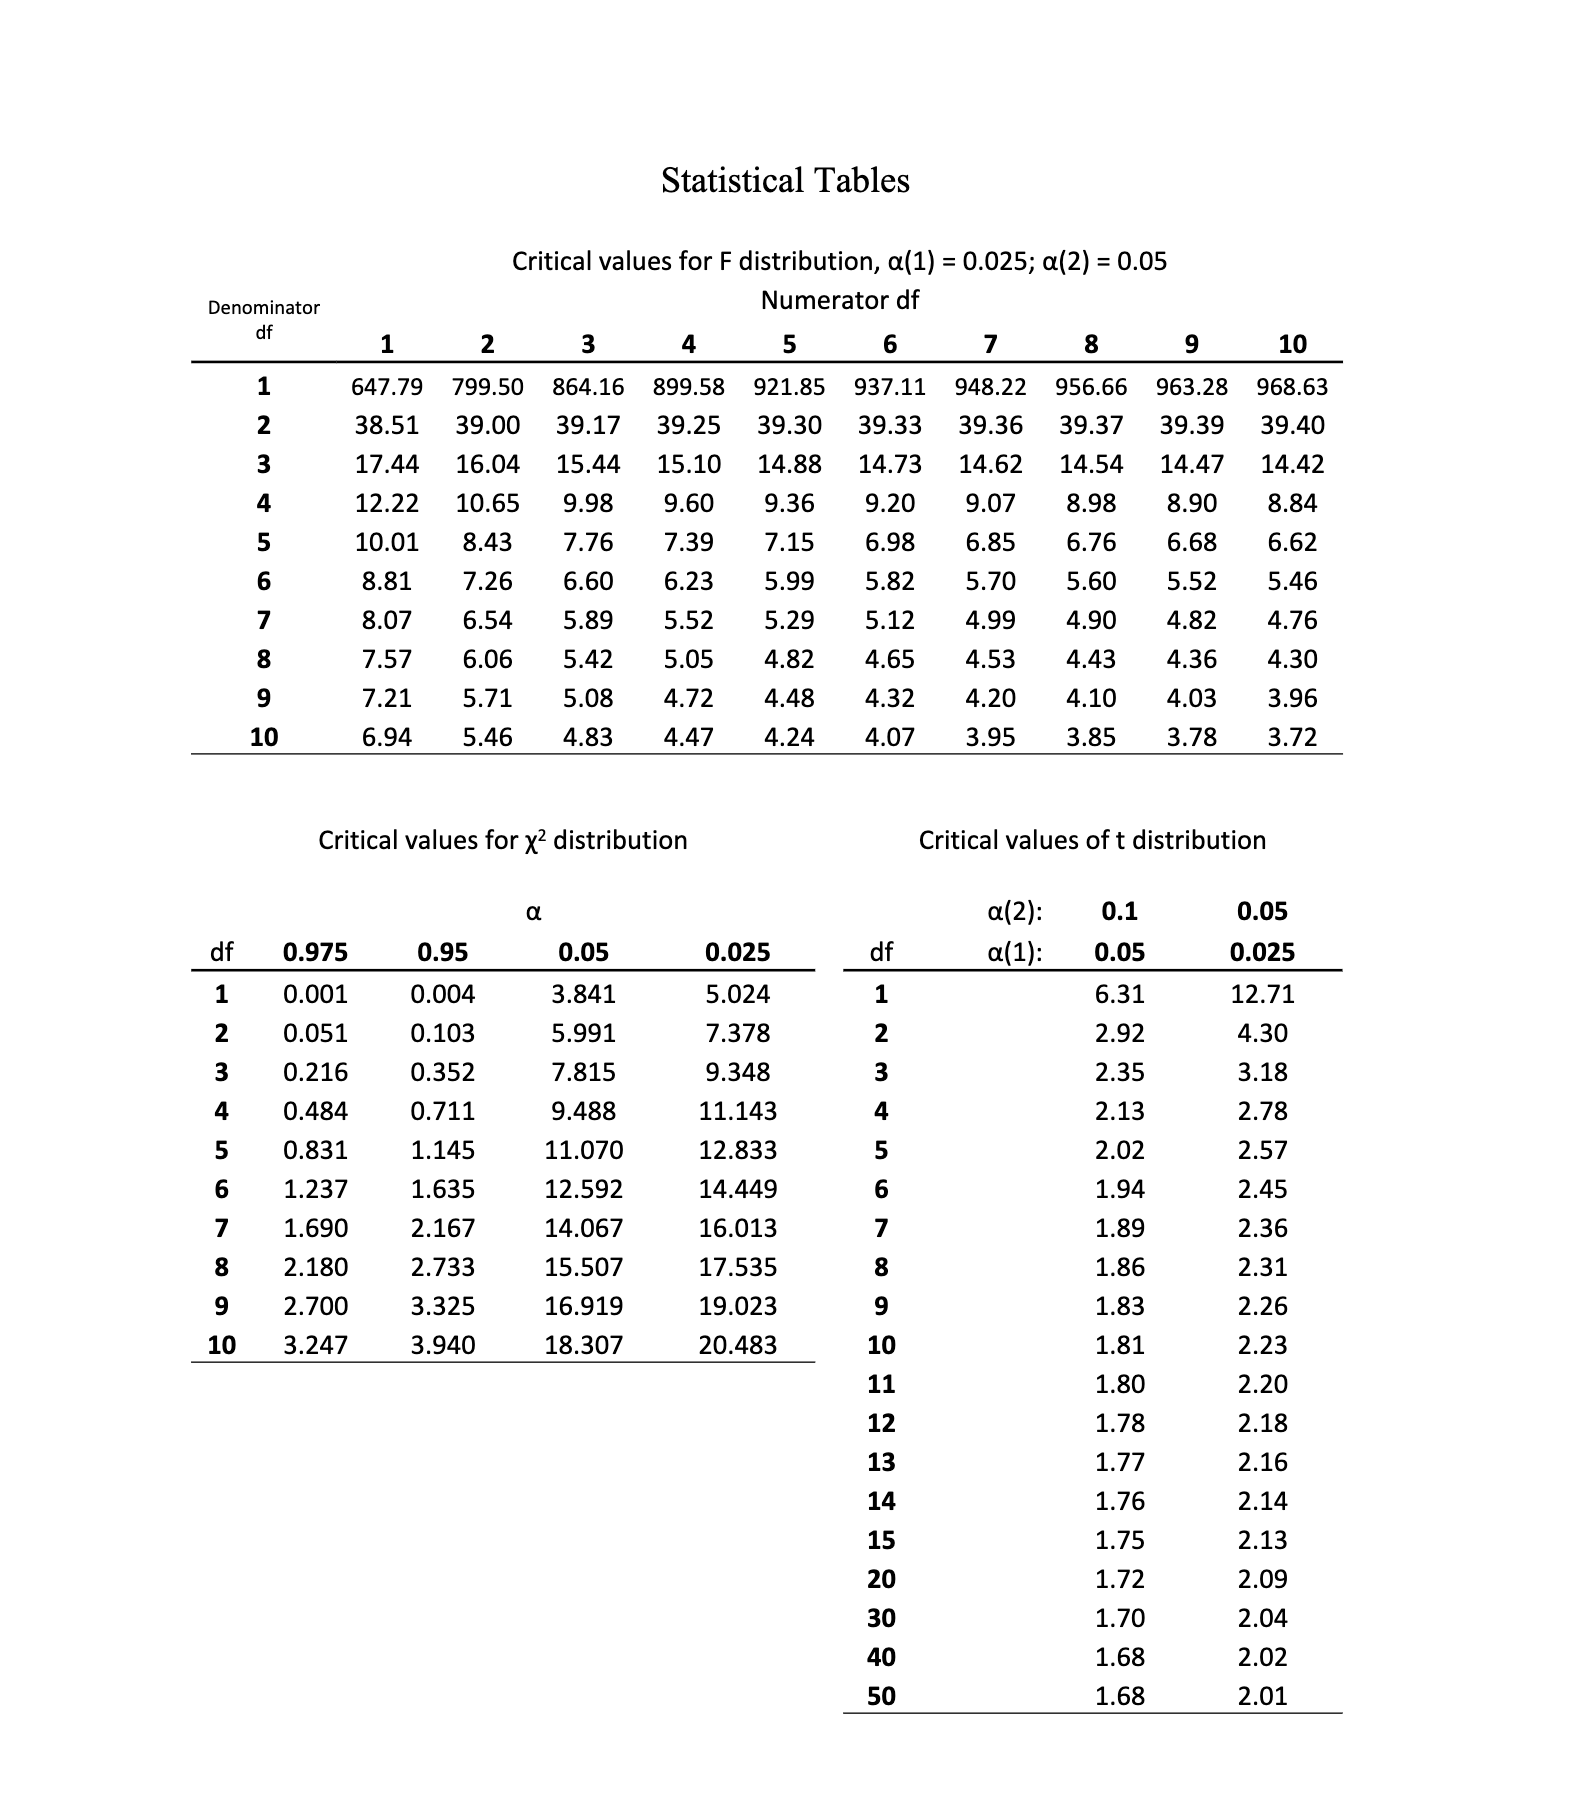
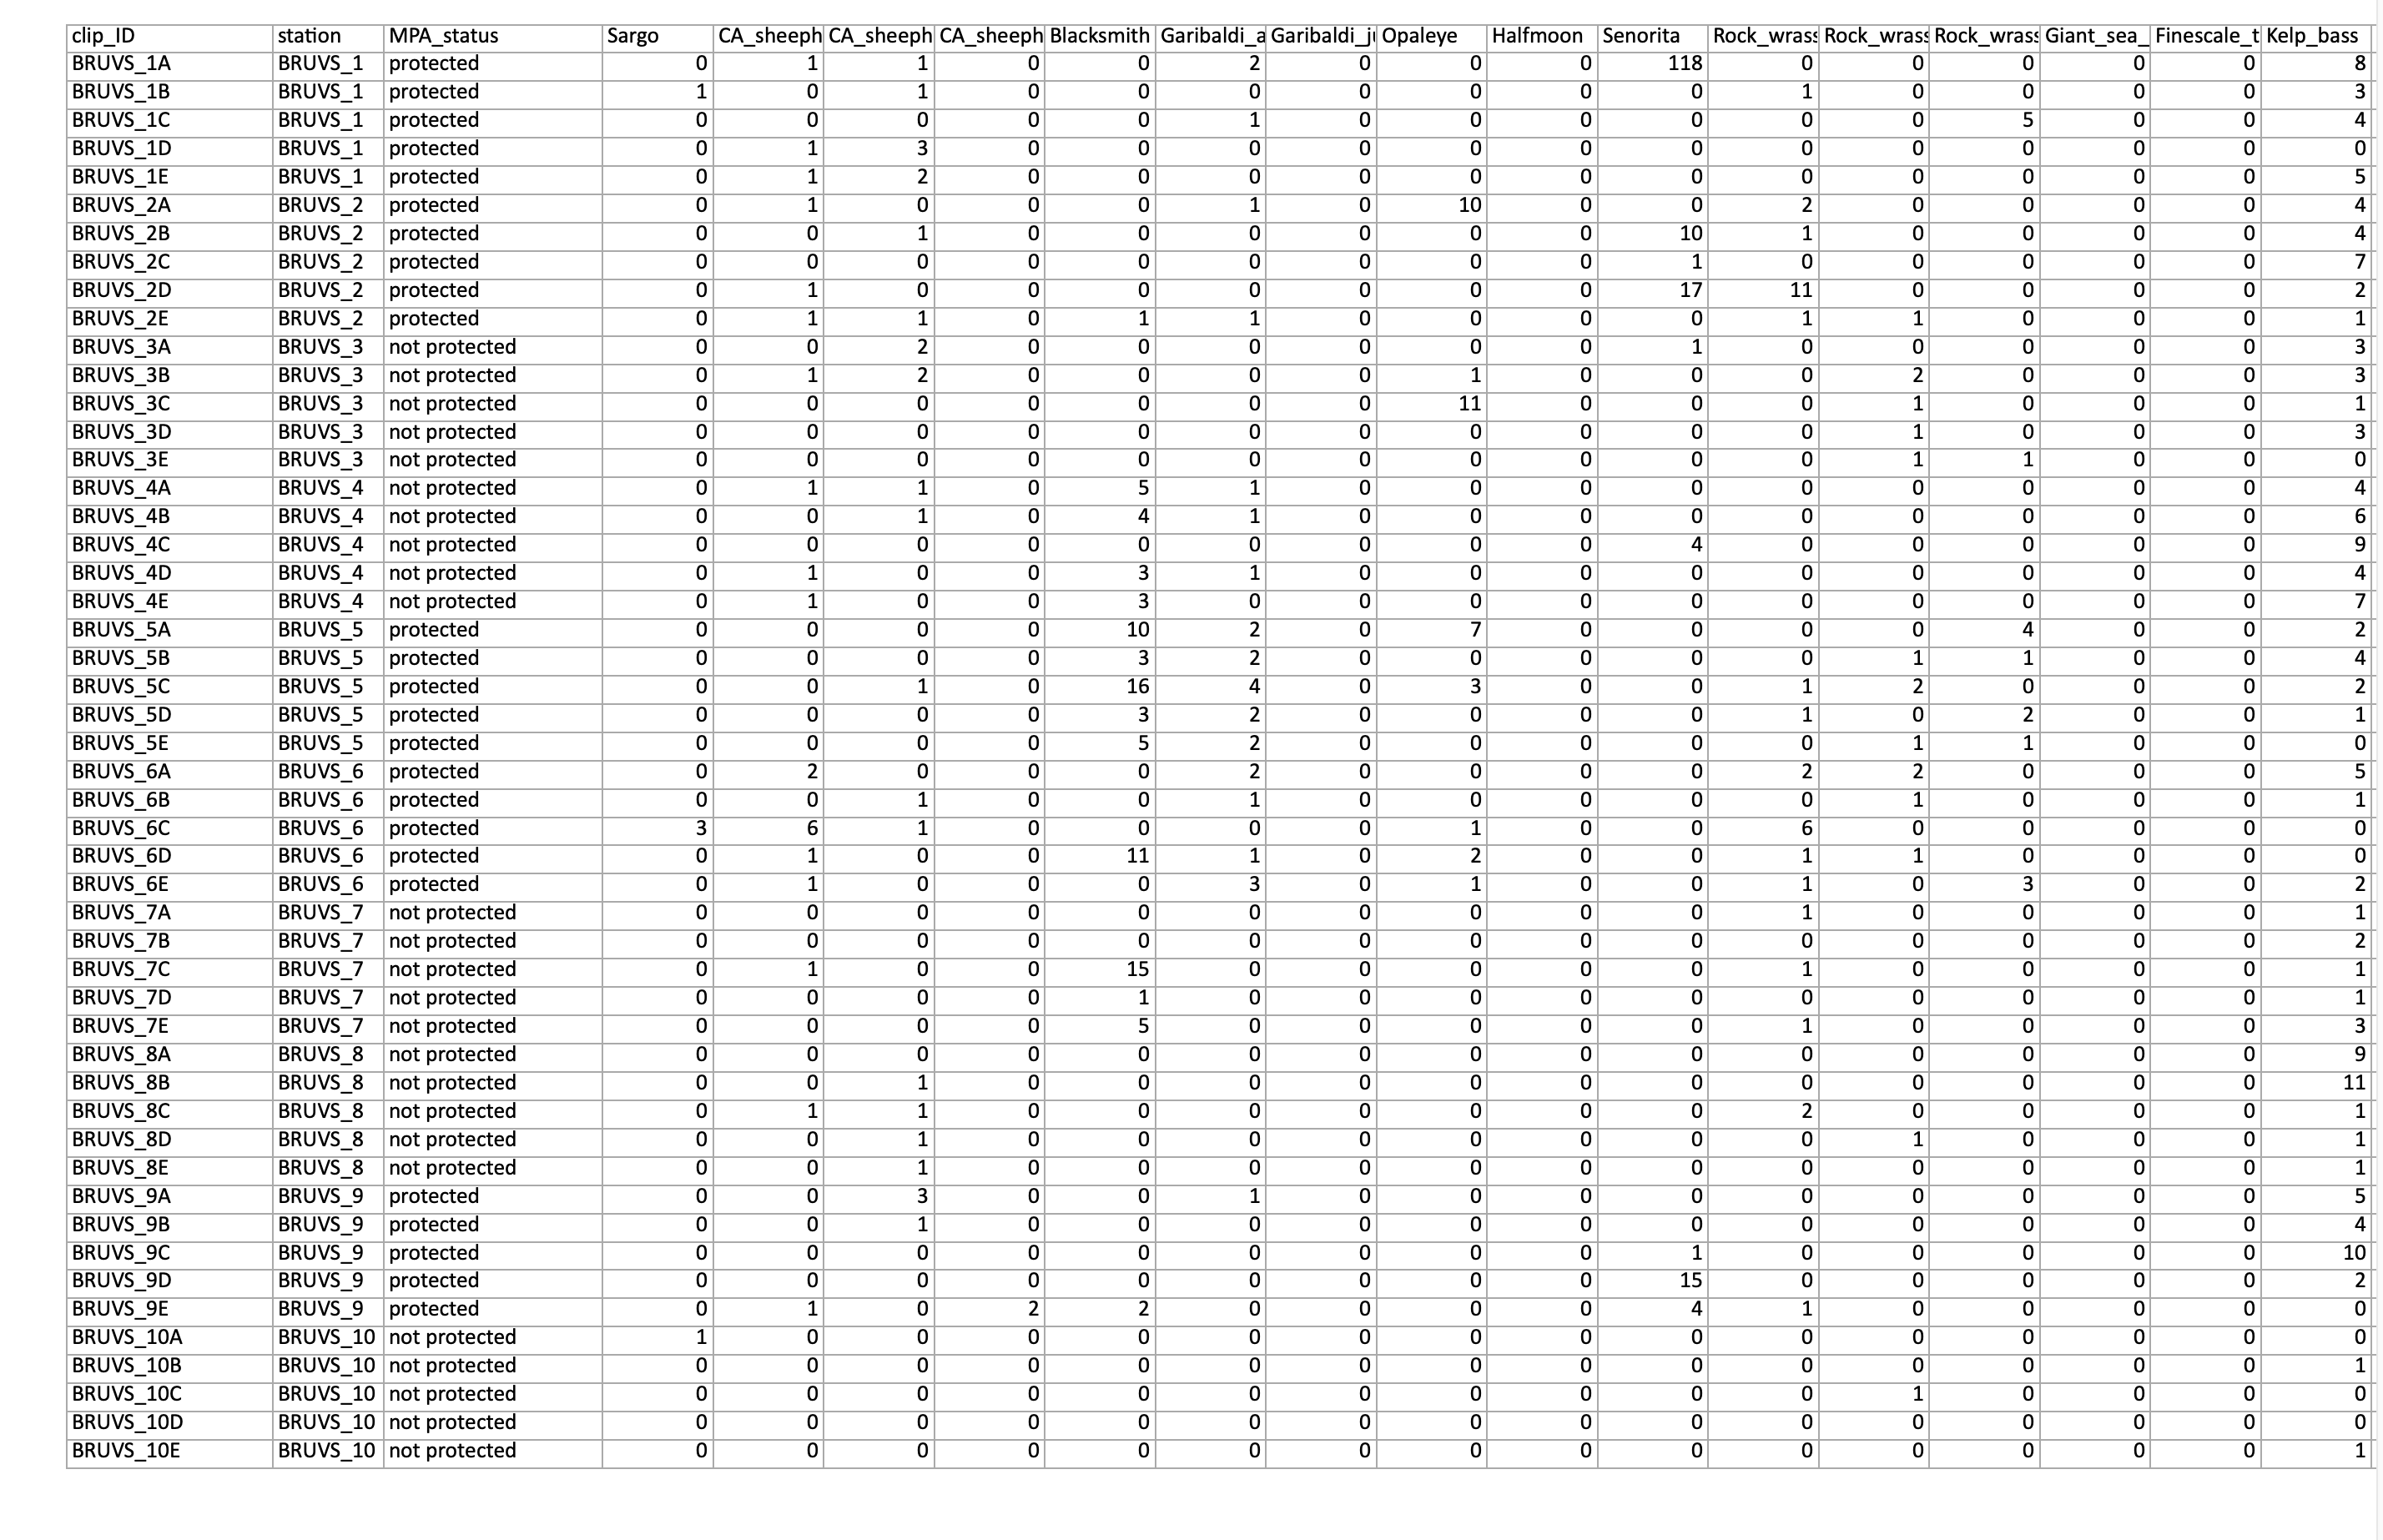
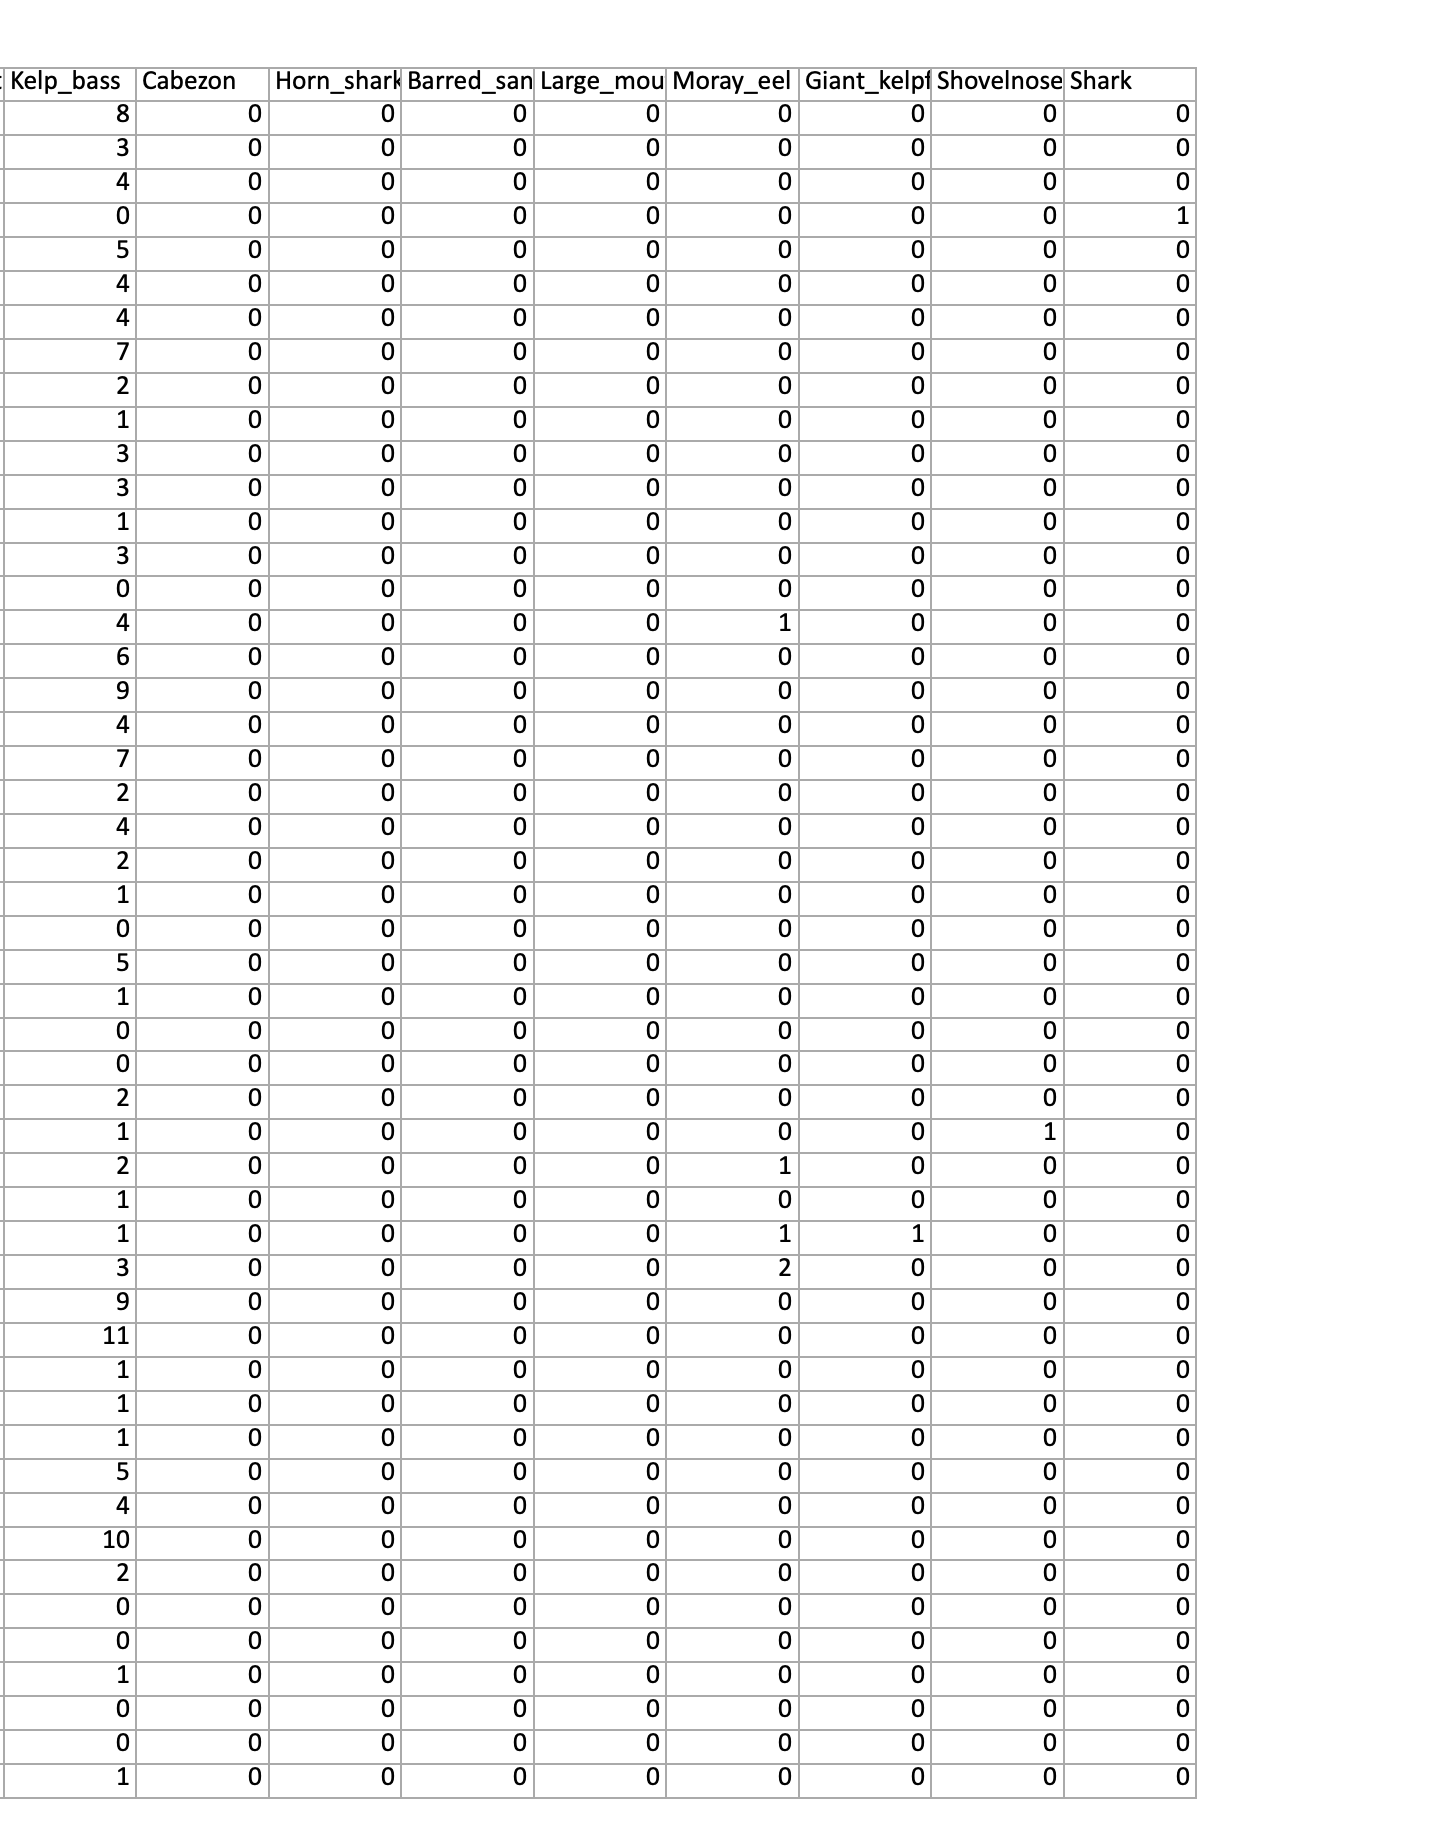
BIOL 260 Assignment 2b Analyze data and answer the 10 questions below. Embed your answers in this document (add space as needed) and turn in ton Canvas as a word file or a pdf. No other file formats are acceptable. Due date = Nov 37; 15 pts total For this assignment, we will continue analyzing the data from the Baited Remote Underwater Video (BRUV) project. Now that you are familiar with how the data were collected, your task will be to do a formal statistical analysis of whether the abundance of fish is different between MPAs and similar habitats in non-protected areas. As a reminder, in this study faculty and students from the CSU Marine Biology Semester deployed Baited Remote Underwater Videos in 5 randomly-selected locations inside the MPA and 5 randomly-selected locations outside the MPA. Part I comparing mean abundances The BIOL 260 BRUVs_abundance.csv data file has the summarized fish counts by species for each video clip. Each column contains counts for a particular species. Calculate the following summary statistics (means, standard deviations, sample sizes) for the counts of fish at each station. Note: to do that, you will need to do some data manipulation in a program like R or Excel. We are interested in counts of all species of fish. You will therefore need to sum the counts across species before making comparisons across stations. Also, the 15s clips from each station are not independent observations. Each station samples the same group of fish, but because fish move and are only sometimes captured by the camera, it is better to calculate the average number of fish at each station and use station as the replicates in the main analyses. With that information in mind, fill in the following table (2pts) MPA status Mean fish per 15s SD n Protected Not protected All statistical analyses make particular assumptions about how the data are distributed. For a two sample t-test, we assume that the data are normally distributed, with equal variances. We did not discuss formal tests of normality in lecture, so for this assignment, just assume that the data come from a Normal Distribution. We did, however, discuss variance comparisons. For these data, test whether the variances are equal. Answer the following questions in the process. 1. When checking variances, what are the null and alternative hypotheses? Write these in terms of the parameters involved. (0.5pts) 2. Calculate the relevant test statistic observed for these data. Include that value here and show your work. (1 pt) 3. Do your results suggest a significant difference in variances? Explain why or why not. Give all the necessary information (including critical value of the statistic, and if appropriate, include details such as degrees of freedom, alpha level, number of tails, etc.) Note, statistical tables are included at the end of this worksheet. (1pt) Regardless of what you found in parts 1-3, use a regular, two-sample t-test to evaluate whether the mean number of fish differed significantly inside and outside of the MPA. In other words proceed as though the variances are equal. 4. What are the null and alternative hypotheses? Write these in terms of the parameters involved. (0.5pts) 5. Calculate the relevant test statistic. Show your work to be eligible for full credit. Note, any formulas you need are in the lecture slides posted on Canvas. (3 pts) 4. What is the critical value for your test statistic? Give all the necessary information (including name of statistic, degrees of freedom, alpha level, and number of tails) (1pt). Tables are available at the end of this document. 5. What do you conclude? (0.5 pts) Part II comparing distributions of fishes inside vs outside MPAs A secondary question is whether Marine Protected Areas affect the relative composition of fish communities. This might happen if certain types of fish are more likely to be affected by a fishing ban than others. To address this question, I sorted some of the species from the BRUV data into 4 different categories: 1. Planktivores (FYI, these fish eat plankton and tend to be small-bodied) . Small Mixed Carnivores (i.e., small-bodied fish that are low on the food chain) 3. Large Mixed Carnivores (fish that eat invertebrates from the sea floor but are large enough in size to be targeted by humans) 4. Large Piscivores (i.e., bigger fish that eat other fish. These species are often fished a lot by humans) The following table contains the observed counts of fish within these categories Species type: | | Small Mixed | Large Mixed Large ' MPA status. Planktivores Carnivores Carnivores Piscivores Inside MPA protected 51 73 17 76 not protected - r ] Test the hypothesis that the relative distribution of fishes within these 4 categories is different inside vs. outside the MPA. 6. What is the name of this particular test? (0.5 pts) 7. Calculate the expected values for each of the eight species and MPA status combinations. Show your work and place the expected values in the table below: (2.5pts) Species type: MPA status: | Planktivores | Small Mixed | Large Mixed Large Carnivores Carnivores Piscivores Inside MPA ' (protected) Outside MPA ' (not protected) 8. Calculate the relevant test statistic. Show your work to be eligible for full credit. Note, any formulas you need are in the lecture slides posted on Canvas. Feel free to copy the table above and use it here if it helps you organize your calculations. (1pt) 9. What is the critical value for your test statistic? Give all the necessary information (including name of statistic, degrees of freedom, alpha level, and number of tails) (1pt) 10. Is there evidence that the MPA affected the relative distribution of fish types? Explain your reasoning (0.5pts) Statistical Tables Critical values for F distribution, a(1) = 0.025; a(2) = 0.05 Denominator Numerator df df 2 3 5 8 9 10 647.79 799.50 864.16 899.58 921.85 937.11 948.22 956.66 963.28 968.63 38.51 39.00 39.17 39.25 39.30 39.33 39.36 39.37 39.39 39.40 17.44 16.04 15.44 15.10 14.88 14.73 14.62 14.54 14.47 14.42 12.22 10.65 9.98 9.60 9.36 9.20 9.07 8.98 8.90 8.84 10.01 8.43 7.76 7.39 7.15 6.98 6.85 6.76 6.68 6.62 OO OO V OUT A W N H 3.81 7.26 6.60 6.23 5.99 5.82 5.70 5.60 5.52 5.46 8.07 6.54 5.89 5.52 5.29 5.12 4.99 4.90 4.82 4.76 7.57 6.06 5.42 5.05 4.82 4.65 4.53 4.43 4.36 4.30 7.21 5.71 5.08 4.72 4.48 4.32 4.20 4.10 4.03 3.96 6.94 5.46 4.83 4.47 4.24 4.07 3.95 3.85 3.78 3.72 Critical values for x2 distribution Critical values of t distribution a(2): 0.1 0.05 0.975 0.95 0.05 0.025 df a(1): 0.05 0.025 0.001 0.004 3.841 5.024 5.3 12.71 0.051 0.103 5.991 7.378 2.92 1.30 0.216 0.352 7.815 9.348 2.35 3.18 0.484 0.711 9.488 11.143 2.13 2.78 0.831 1.145 11.070 12.833 DONUT AWN 2.02 2.57 1.237 1.635 12.592 14.449 1.94 2.45 1.690 2.167 14.067 16.013 1.89 2.36 2.180 2.733 15.507 17.535 1.86 2.31 2.700 3.325 16.919 19.023 9 1.83 2.26 10 3.247 3.940 18.307 20.483 10 1.81 2.23 11 1.80 2.20 12 1.78 2.18 13 1.77 2.16 14 1.76 2.14 15 1.75 2.13 20 1.72 2.09 30 1.70 2.04 40 1.68 2.02 50 1.68 2.01\f\f
Step by Step Solution
There are 3 Steps involved in it
1 Expert Approved Answer
Step: 1 Unlock
Question Has Been Solved by an Expert!
Get step-by-step solutions from verified subject matter experts
Step: 2 Unlock
Step: 3 Unlock
Students Have Also Explored These Related Mathematics Questions!