

Question: Bivariate data obtained for the paired variables x and y are shown below, in the table labeled Sample data.'I These data are plotted in the

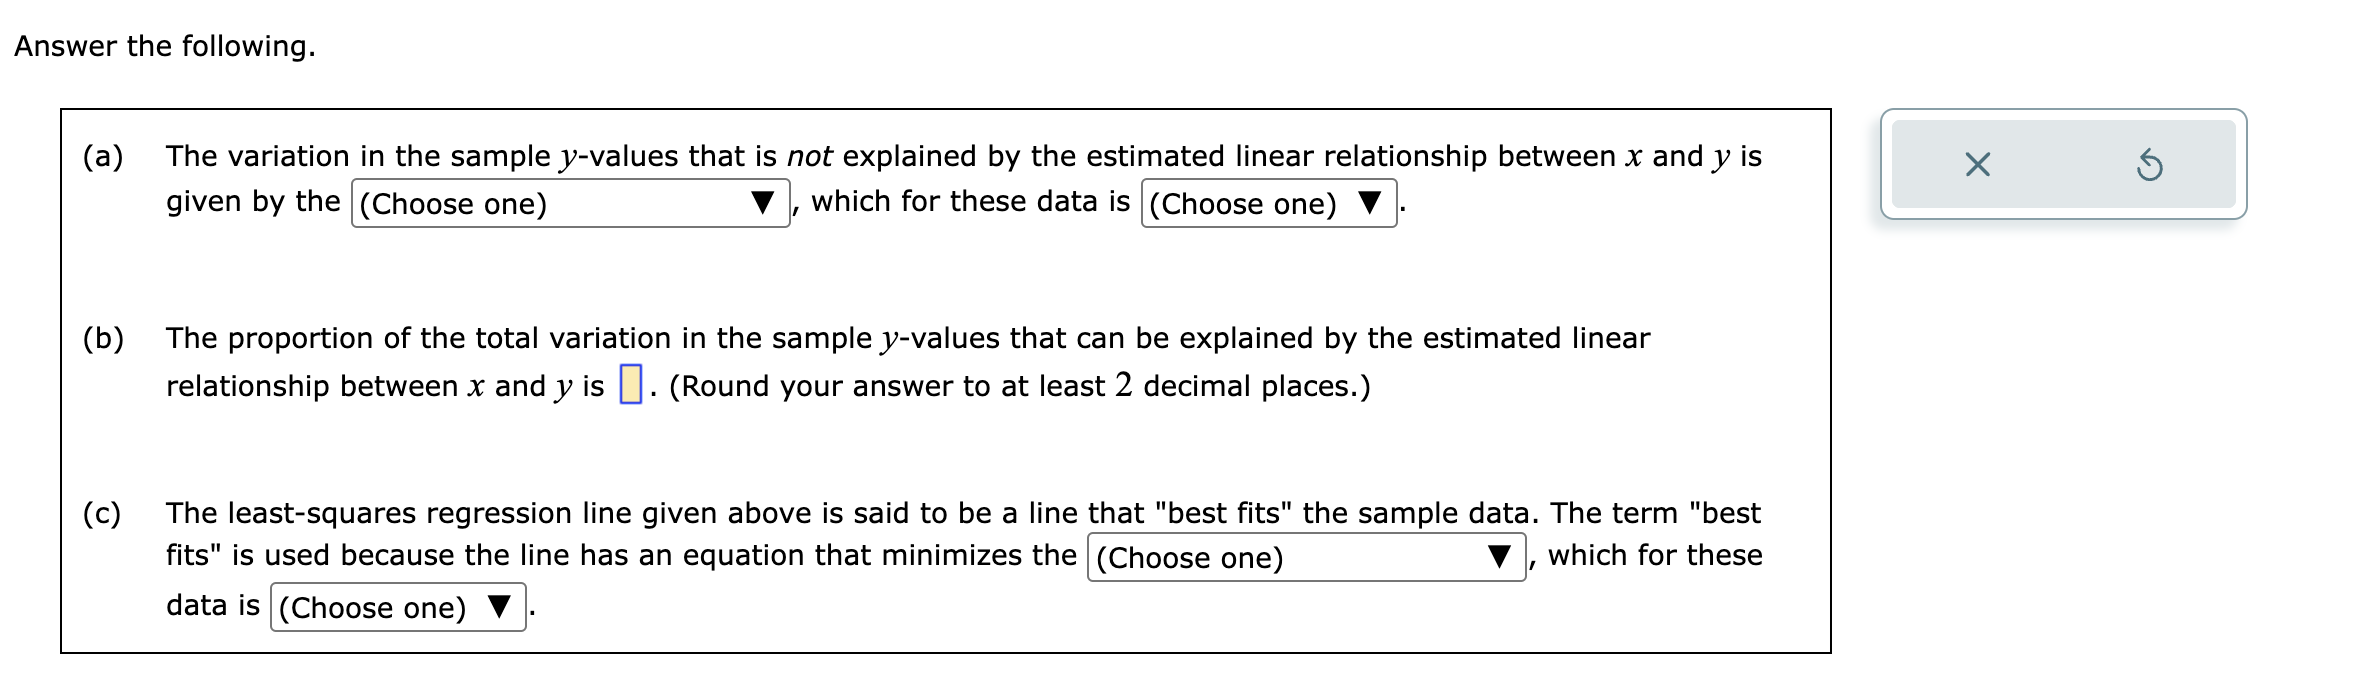
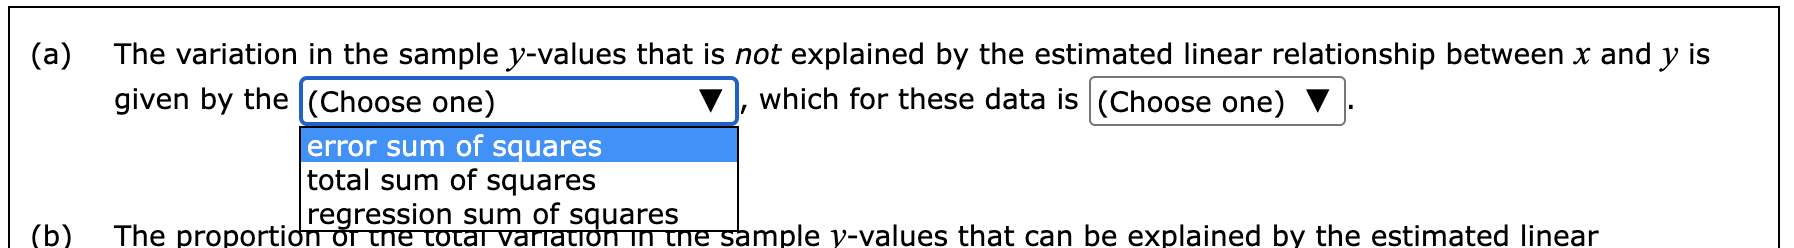
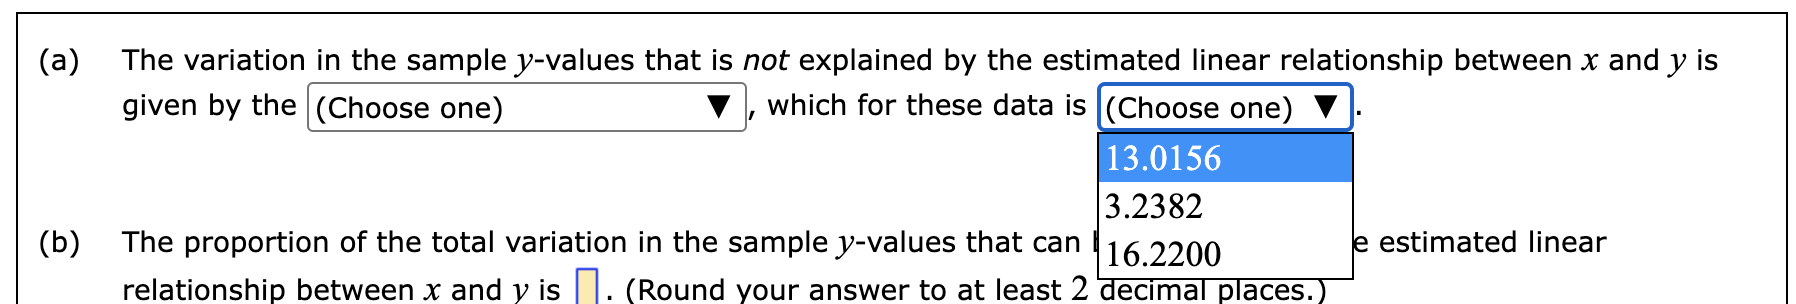
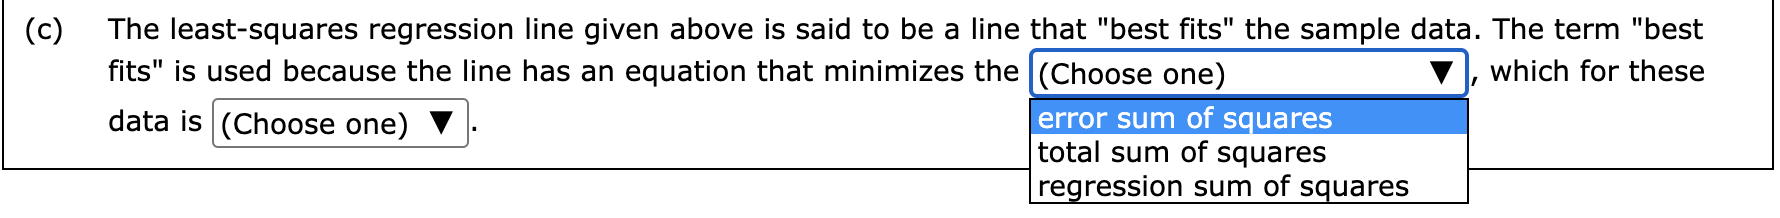

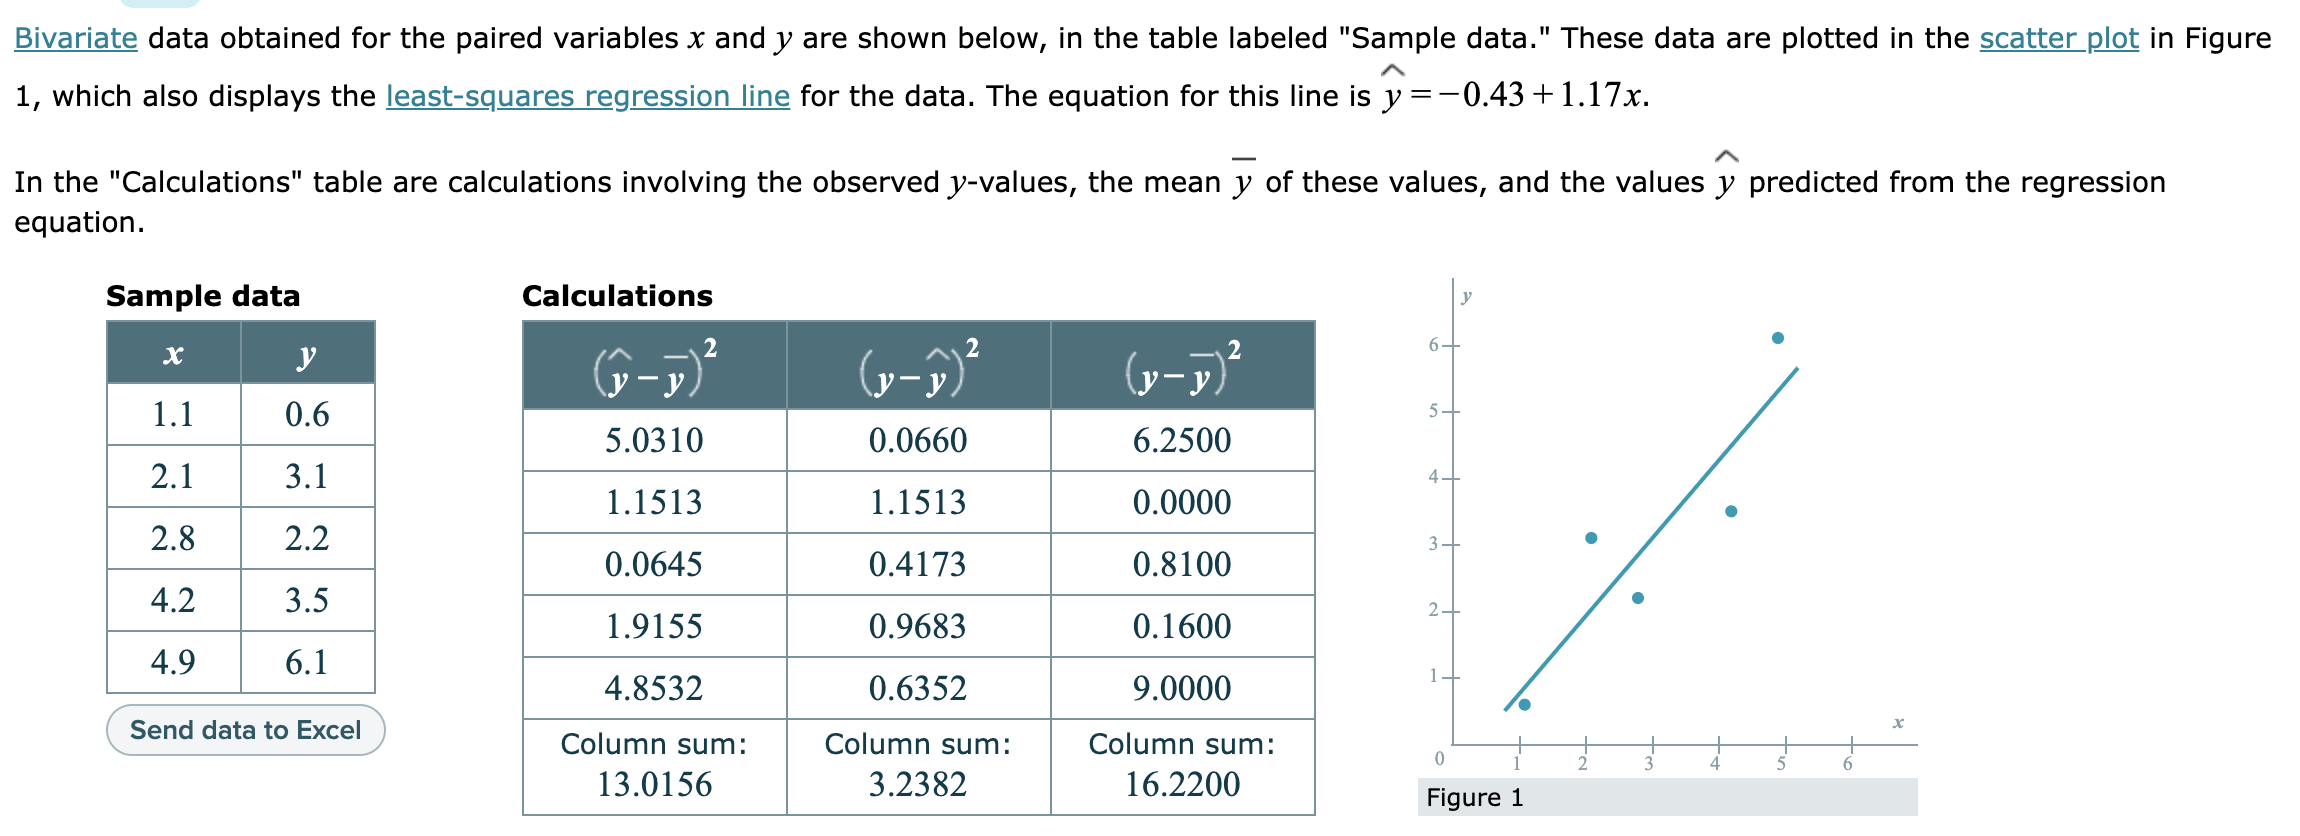


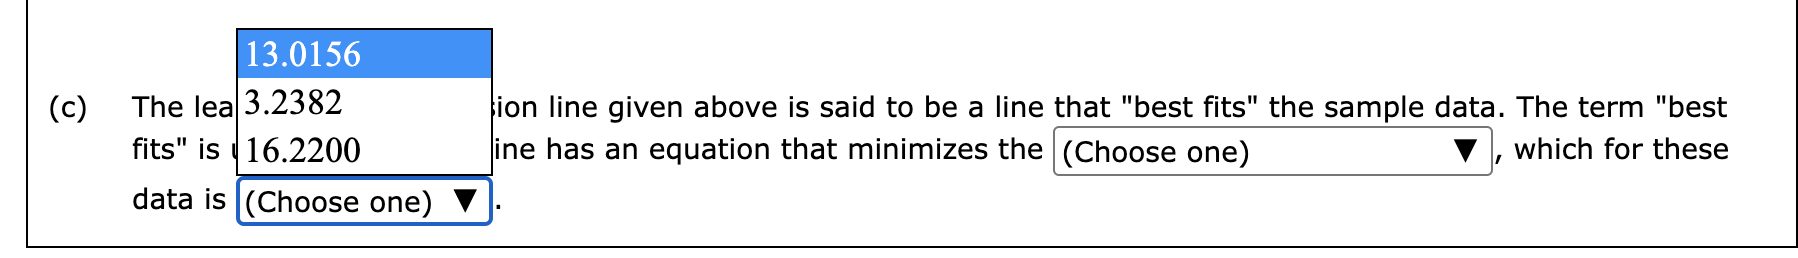
Bivariate data obtained for the paired variables x and y are shown below, in the table labeled "Sample data.'I These data are plotted in the scatter pl_ot in Figure A 1, which also displays the leastsquares regression line for the data. The equation for this line is y = 0.43 +1.17x. _ A In the "Calculations" table are calculations involving the observed y-values, the mean y of these values, and the values y predicted from the regression equation. Sample data Calculations y x /\\ _ 2 A 2 2 w w (m) 1.1 0.6 5.0310 0.0660 6.2500 2.1 3.1 1.1513 1.1513 0.0000 2.8 2.2 0.0645 0.4173 0.8100 4.2 3.5 1.9155 0.9683 0.1600 4.9 6.1 4.8532 0.6352 9.0000 Send data m Excel Column sum: Column sum: Column sum: 13.0156 3.2382 16.2200 Figure 1 Answer the following. (a) (b) (C) The variation in the sample y-values that is not explained by the estimated linear relationship between x and y is given by the (Choose one) V , which for these data is (Choose one) V . The proportion of the total variation in the sample yvalues that can be explained by the estimated linear relationship between x and y is . (Round your answer to at least 2 decimal places.) The least-squares regression line given above is said to be a line that "best fits" the sample data. The term "best fits" is used because the line has an equation that minimizes the (Choose one) V , which for these data is (Choose one) V . (a) The variation in the sample y-values that is not explained by the estimated linear relationship between x and y is given by the (Choose one) which for these data is (Choose one) error sum of squares total sum of squares ( b ) regression sum of squares The proportion of the total I variation m the sample y-values that can be explained by the estimated linear(a) The variation in the sample y-values that is not explained by the estimated linear relationship between x and y is given by the (Choose one) V , which for these data is (Choose one) V . 13.0156 3.2382 (b) The proportion of the total variation in the sample y-values that can 16 2200 - estimated linear relationship between x and y is H. (Round your answer to at least 2 -eCIma p aces. (c) The least-squares regression line given above is said to be a line that "best fits" the sample data. The term "best fits" is used because the line has an equation that minimizes the (Choose one) which for these data is (Choose one) V error sum of squares total sum of squares regression sum of squares13.0156 (c) The lea 3.2382 ion line given above is said to be a line that "best fits" the sample data. The term "best ts" is 162200 ine has an equation that minimizes the [(Choose one) V , which for these data is (Choose one) V
Step by Step Solution
There are 3 Steps involved in it

Get step-by-step solutions from verified subject matter experts