

Question: Bivariate data obtained for the paired variables x and y are shown below, in the table labeled Sample data. These data are plotted in the
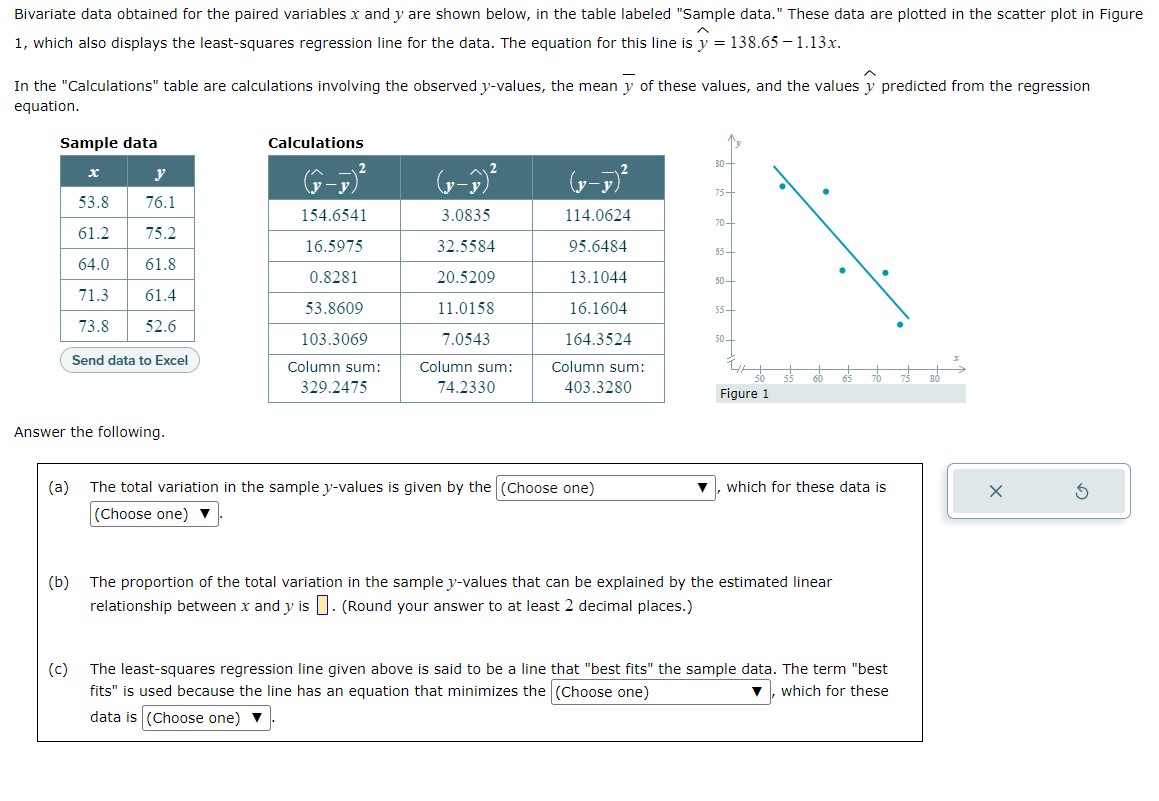

Bivariate data obtained for the paired variables x and y are shown below, in the table labeled "Sample data." These data are plotted in the scatter plot in Figure A 1, which also displays the leastsquares regression line for the data. The equation for this line is y = 138.65 1.13x. _ A In the "Calculations" table are calculations involving the observed yvalues, the mean y ofthese values, and the values y predicted from the regression equation. Sample data Calculations ' 53.8 76.1 ' 15.4.6541 3.0835 114.0624 _ 61.2 75.2 16.5975. 32.55.84 95.6484 _ 64.0 61.8 0.8281 20.5209 13.1044 _ 71.3 61.4 53.8609 11.0158 16.1604 73.8 52.6 103.3069 7.0543 164.3524 - Send da'tatc Exce: Column sum: Column sum: Column sum: 44iii'iiii\\\\- 329.2475 74.2330 403.3280 Figure; " " " ' ' " Answer the following. relationship between x and y is . (Round your answer to at least 2 decimal places.) (a) The total variation in the sample yvalues is given by the I (Choose one) Y . which for these data is _ (b) The proportion of the total variation in the sample yvalues that can be explained by the estimated linear (c) The leastsquares regression line given above is said to be a line that "best fits" the sample data. The term "best fits" is used because the line has an equation that minimizes the (Choose one) Y . which for these data is (Choose one) Y
Step by Step Solution
There are 3 Steps involved in it

Get step-by-step solutions from verified subject matter experts