

Question: Bivariate Regression You may use Excel for the calculations but transfer these intermediate results to the appropriate formulas on your answer sheet. Use at least
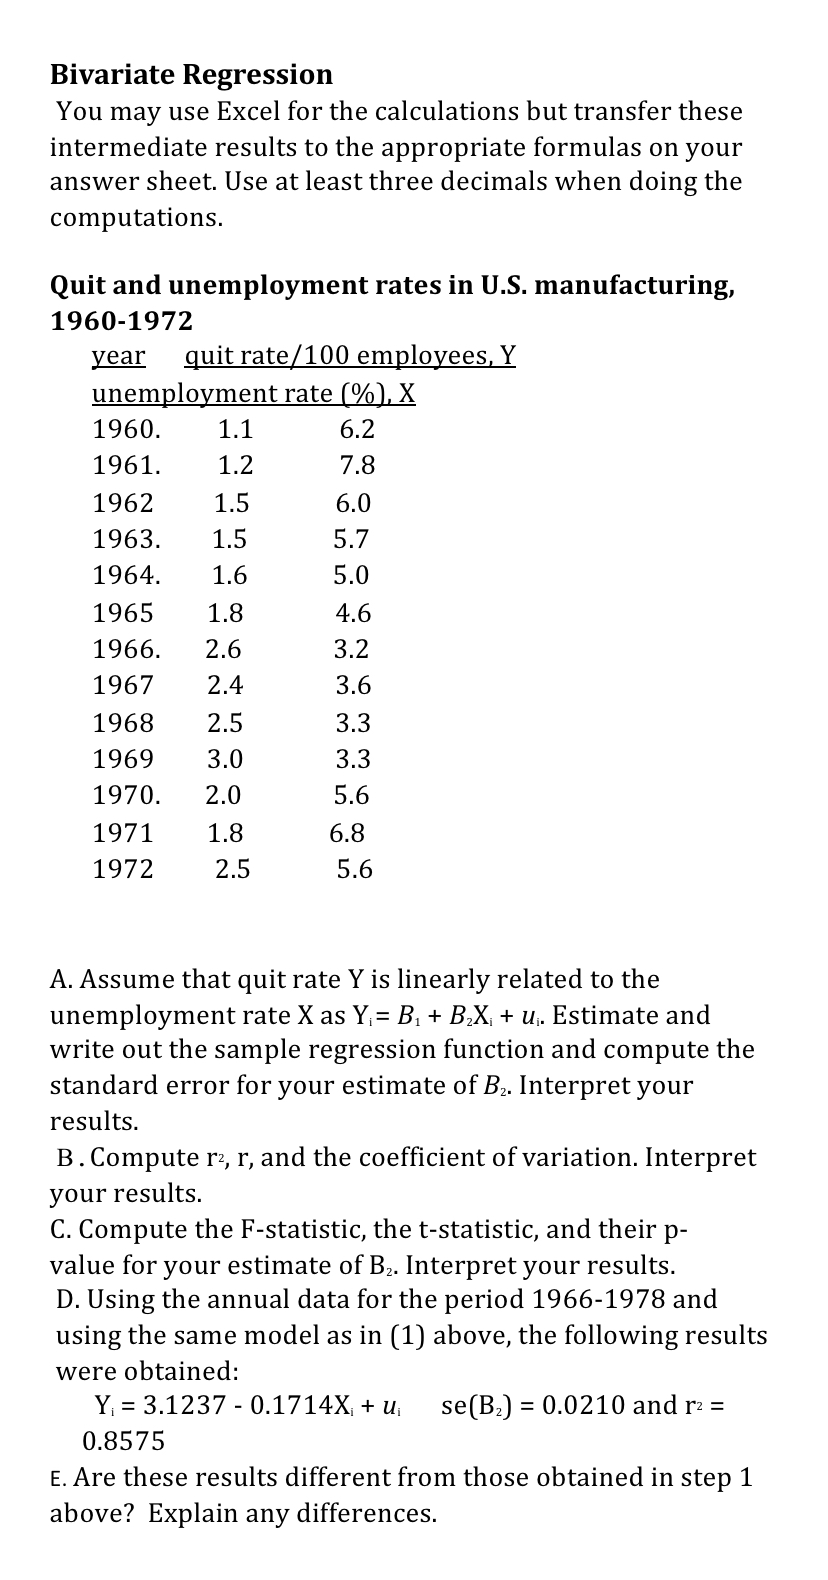

Bivariate Regression You may use Excel for the calculations but transfer these intermediate results to the appropriate formulas on your answer sheet. Use at least three decimals when doing the computations. Quit and unemployment rates in U.S. manufacturing, 1960-1972 year guit rate100 employees. Y unemployment rate 1% l. X 1960. 1.1 6.2 1961. 1.2 7.8 1962 1.5 6.0 1963. 1.5 5.7 1964. 1.6 5.0 1965 1.8 4.6 1966. 2.6 3.2 1967 2.4 3.6 1968 2.5 3.3 1969 3.0 3.3 1970. 2.0 5.6 1971 1.8 6.8 1972 2.5 5.6 A. Assume that quit rate Y is linearly related to the unemployment rate X as Y.= 81 + BZXi + u.. Estimate and write out the sample regression function and compute the standard error for your estimate of 32. Interpret your results. B . Compute r2, r, and the coefficient ofvariation. Interpret your results. C. Compute the F-statistic, the t-statistic, and their p- value for your estimate of B2. Interpret your results. D. Using the annual data for the period 1966-1978 and using the same model as in (1) above, the following results were obtained: Y. = 3.1237 - 0.1711lei + ui se[Bz) = 0.0210 and r2 = 0.8575 E. Are these results different from those obtained in step 1 above? Explain any differences
Step by Step Solution
There are 3 Steps involved in it

Get step-by-step solutions from verified subject matter experts