

Question: BlockPy: #49.1) Basic Histogram Create a list of ten numbers. These numbers can be high, low, the same, or different - it's up to
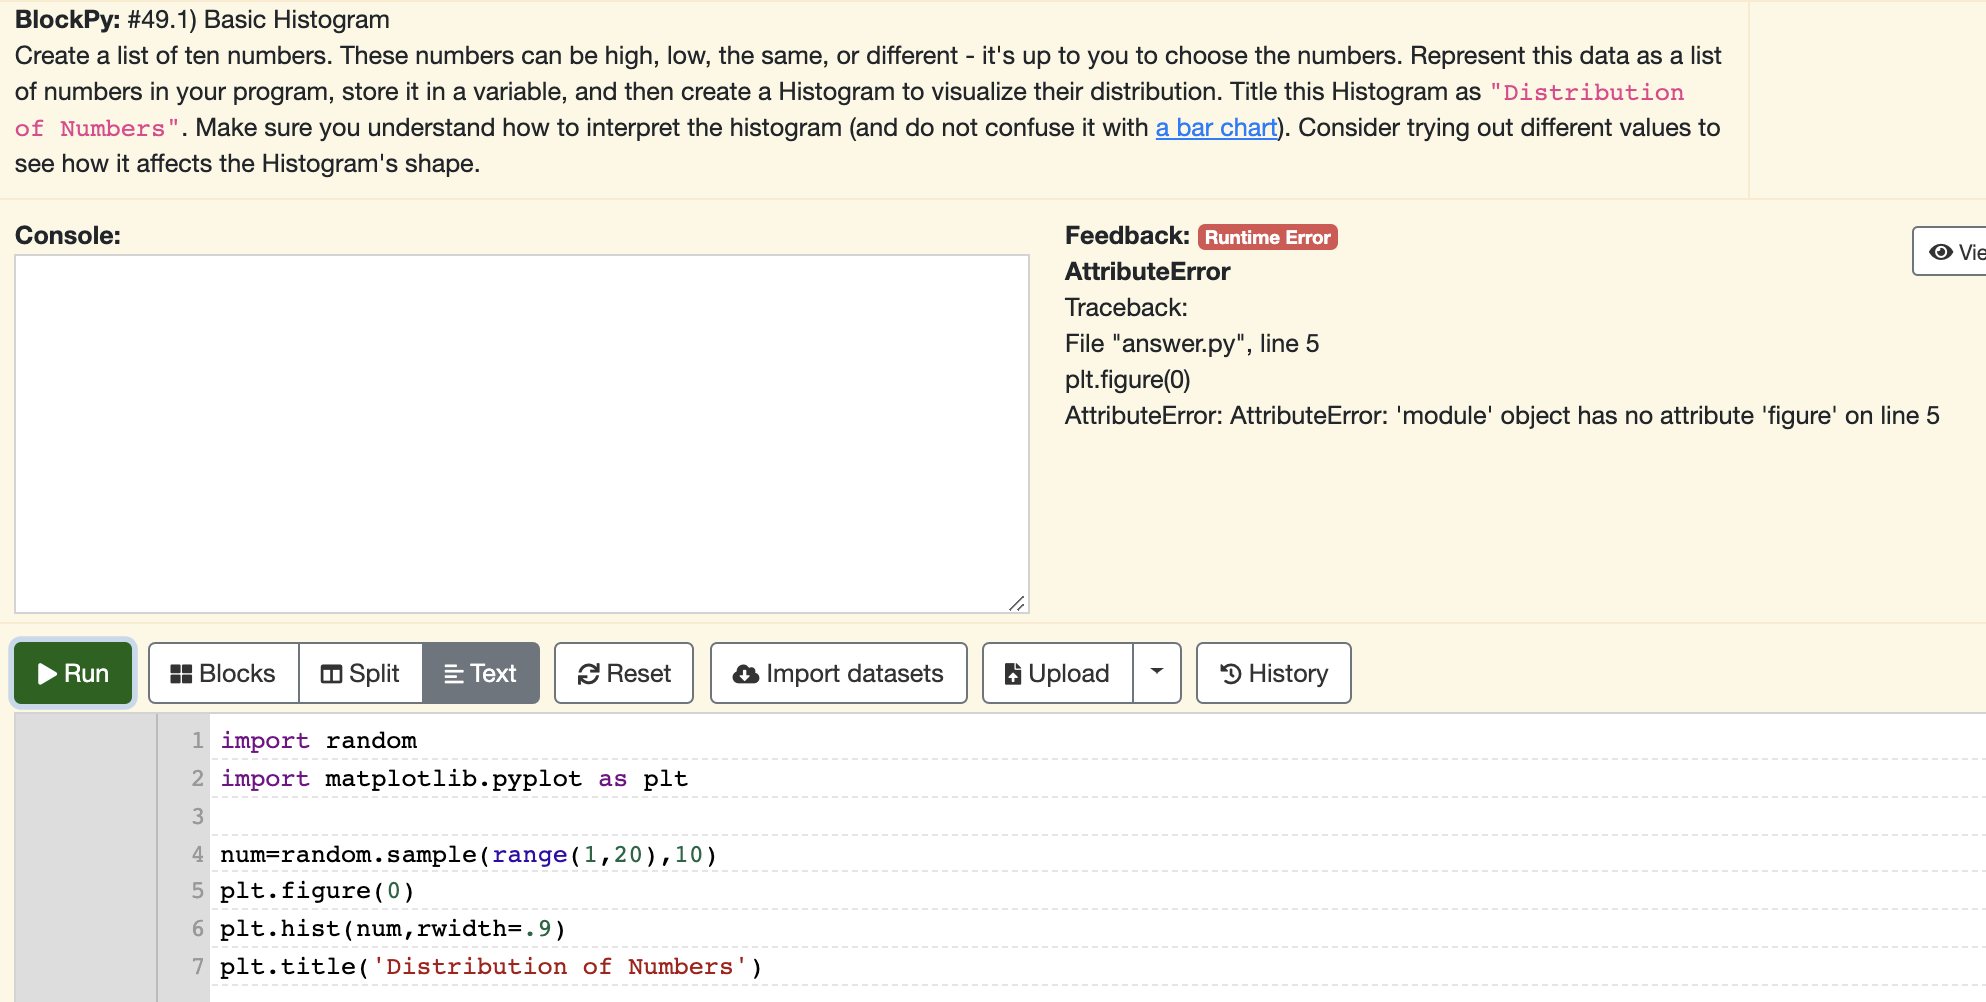
BlockPy: #49.1) Basic Histogram Create a list of ten numbers. These numbers can be high, low, the same, or different - it's up to you to choose the numbers. Represent this data as a list of numbers in your program, store it in a variable, and then create a Histogram to visualize their distribution. Title this Histogram as "Distribution of Numbers". Make sure you understand how to interpret the histogram (and do not confuse it with a bar chart). Consider trying out different values to see how it affects the Histogram's shape. Console: Feedback: Runtime Error AttributeError O Vie Traceback: File "answer.py", line 5 plt.figure(0) AttributeError: AttributeError: 'module' object has no attribute 'figure' on line 5 Run Blocks Split E Text Reset Import datasets Upload History 1 import random 2 import matplotlib.pyplot as plt 3 4 num=random.sample(range (1,20), 10) 5 plt.figure (0) 6 plt.hist (num, rwidth=.9) 7 plt.title('Distribution of Numbers')
Step by Step Solution
3.32 Rating (149 Votes )
There are 3 Steps involved in it
import random import matplotlibpyplot as pl... View full answer

Get step-by-step solutions from verified subject matter experts