

Question: Blooper's analysts have come up with the following revised estimates for its magnoosium mine: Conduct a sensitivity analysis for each variable and range and compute
Blooper's analysts have come up with the following revised estimates for its magnoosium mine:
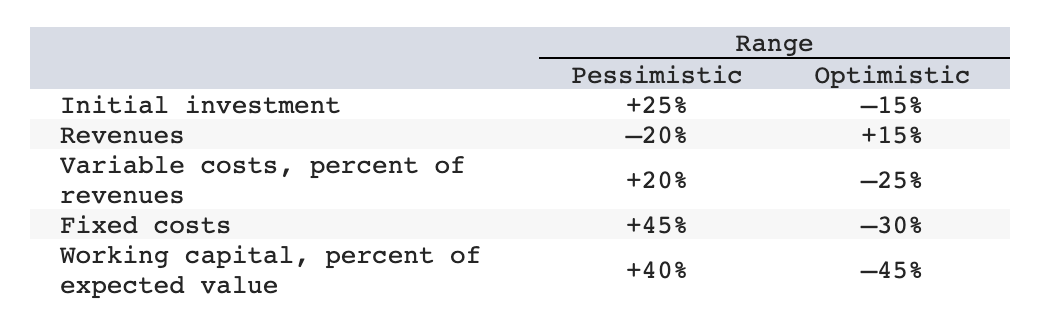
Conduct a sensitivity analysis for each variable and range and compute the NPV for each. Use spreadsheet 10.1 below and accompanying data as a starting point for analysis.
Note: Do not round intermediate calculations. Negative amounts should be indicated by a minus sign. Enter your answer in millions rounded to 2 decimal places.
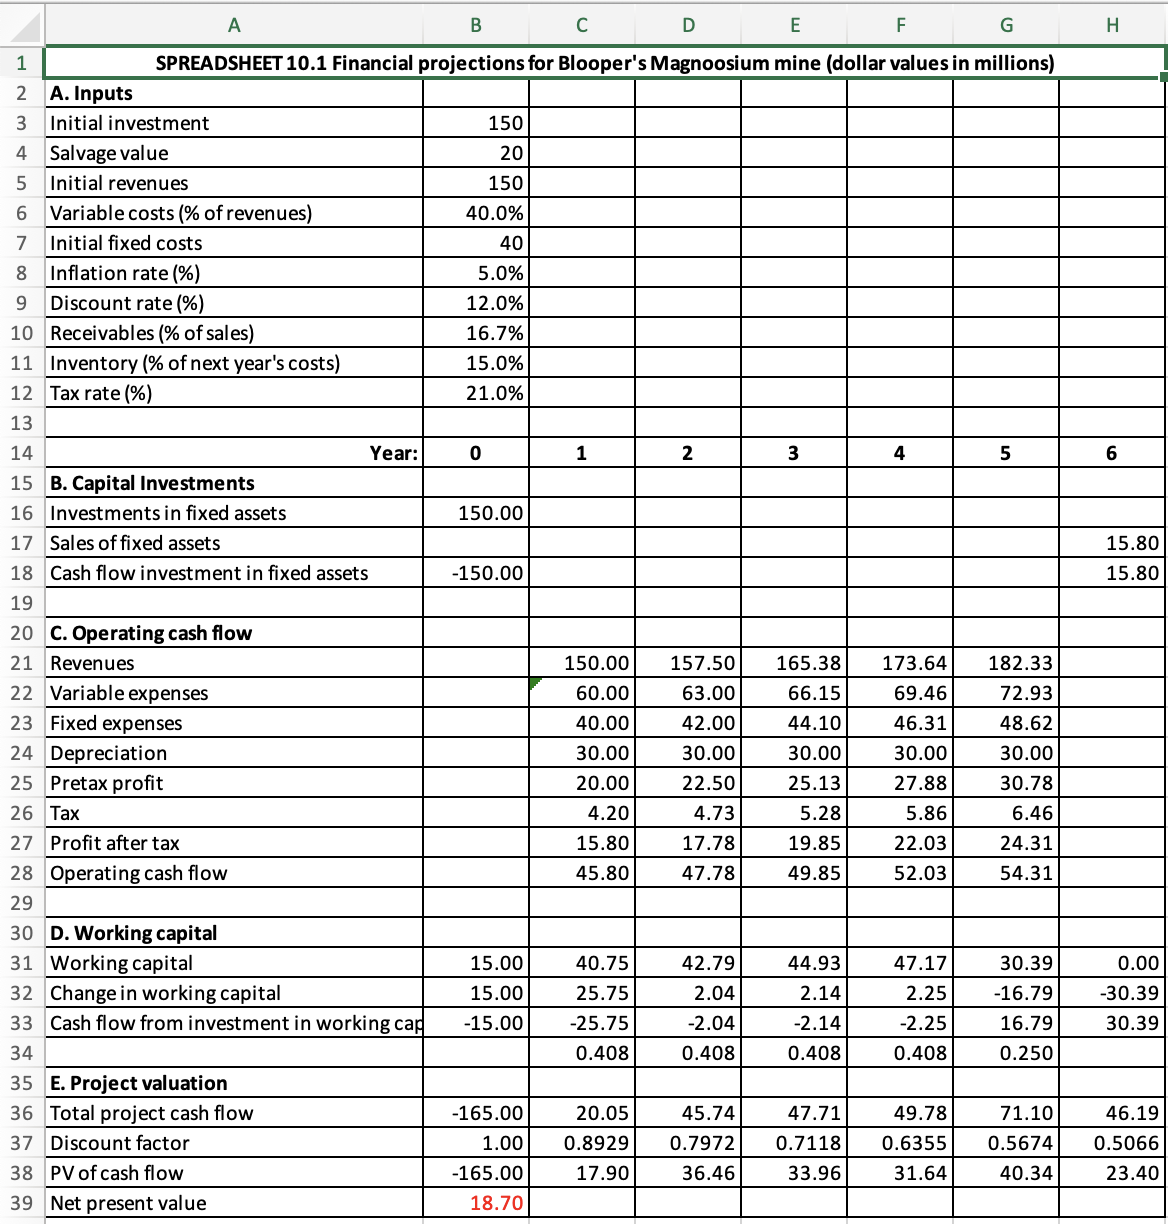
1 2 A. Inputs 8069 SA EN 3 Initial investment Salvage value Initial revenues Variable costs (% of revenues) Initial fixed costs Inflation rate (%) 9 Discount rate (%) 10 Receivables (% of sales) 4 5 A B C D E F G SPREADSHEET 10.1 Financial projections for Blooper's Magnoosium mine (dollar values in millions) 7 11 Inventory (% of next year's costs) 12 Tax rate (%) 13 14 15 B. Capital Investments 16 Investments in fixed assets 17 Sales of fixed assets 18 Cash flow investment in fixed assets 19 20 C. Operating cash flow 21 Revenues 22 Variable expenses 23 Fixed expenses 24 Depreciation 25 Pretax profit 26 Tax 27 Profit after tax 28 Operating cash flow 29 30 D. Working capital 31 Working capital 32 Change in working capital 33 Cash flow from investment in working cap 34 35 E. Project valuation 36 Total project cash flow 37 Discount factor 38 PV of cash flow 39 Net present value Year: 150 20 150 40.0% 40 5.0% 12.0% 16.7% 15.0% 21.0% 0 150.00 -150.00 15.00 15.00 -15.00 -165.00 1.00 -165.00 18.70 1 2 150.00 157.50 60.00 63.00 40.00 42.00 30.00 30.00 20.00 22.50 4.20 4.73 15.80 17.78 45.80 47.78 40.75 25.75 -25.75 0.408 42.79 2.04 -2.04 0.408 20.05 45.74 0.8929 0.7972 17.90 36.46 3 165.38 173.64 66.15 69.46 44.10 46.31 30.00 30.00 25.13 27.88 5.28 5.86 19.85 22.03 49.85 52.03 44.93 2.14 -2.14 0.408 4 47.71 0.7118 33.96 47.17 2.25 -2.25 0.408 49.78 0.6355 31.64 5 182.33 72.93 48.62 30.00 30.78 6.46 24.31 54.31 30.39 -16.79 16.79 0.250 71.10 0.5674 40.34 H 6 15.80 15.80 0.00 -30.39 30.39 46.19 0.5066 23.40
Step by Step Solution
There are 3 Steps involved in it
I will conduct the sensitivity analysis for the given vari... View full answer

Get step-by-step solutions from verified subject matter experts
Document Format (1 attachment)
20250303_064631.xlsx
300 KBs Excel File