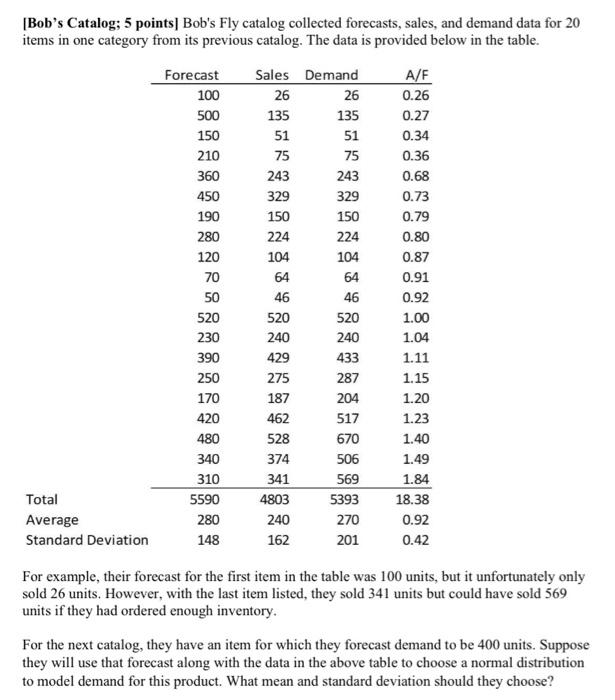
Question: [Bob's Catalog; 5 points | Bob's Fly catalog collected forecasts, sales, and demand data for 20 items in one category from its previous catalog. The

[Bob's Catalog; 5 points | Bob's Fly catalog
[Bob's Catalog; 5 points | Bob's Fly catalog collected forecasts, sales, and demand data for 20 items in one category from its previous catalog. The data is provided below in the table. A/F 135 Forecast 100 500 150 210 360 450 190 280 75 329 120 70 50 520 230 390 250 170 420 480 340 310 5590 280 148 Sales Demand 26 26 135 51 51 75 243 243 329 150 150 224 224 104 104 64 64 46 46 520 520 240 240 429 433 275 287 187 204 462 517 528 670 374 506 341 569 4803 5393 240 270 162 201 0.26 0.27 0.34 0.36 0.68 0.73 0.79 0.80 0.87 0.91 0.92 1.00 1.04 1.11 1.15 1.20 1.23 1.40 1.49 1.84 18.38 0.92 0.42 Total Average Standard Deviation For example, their forecast for the first item in the table was 100 units, but it unfortunately only sold 26 units. However, with the last item listed, they sold 341 units but could have sold 569 units if they had ordered enough inventory. For the next catalog, they have an item for which they forecast demand to be 400 units. Suppose they will use that forecast along with the data in the above table to choose a normal distribution to model demand for this product. What mean and standard deviation should they choose

Step by Step Solution

There are 3 Steps involved in it

1 Expert Approved Answer
Step: 1 Unlock blur-text-image
Question Has Been Solved by an Expert!

Get step-by-step solutions from verified subject matter experts

Step: 2 Unlock
Step: 3 Unlock

Students Have Also Explored These Related General Management Questions!