

Question: BONUS QUESTION Question 7. Tree diameter distributions from two forest ecosites - B049 and B127 were generated using R. Base on the R outputs below,
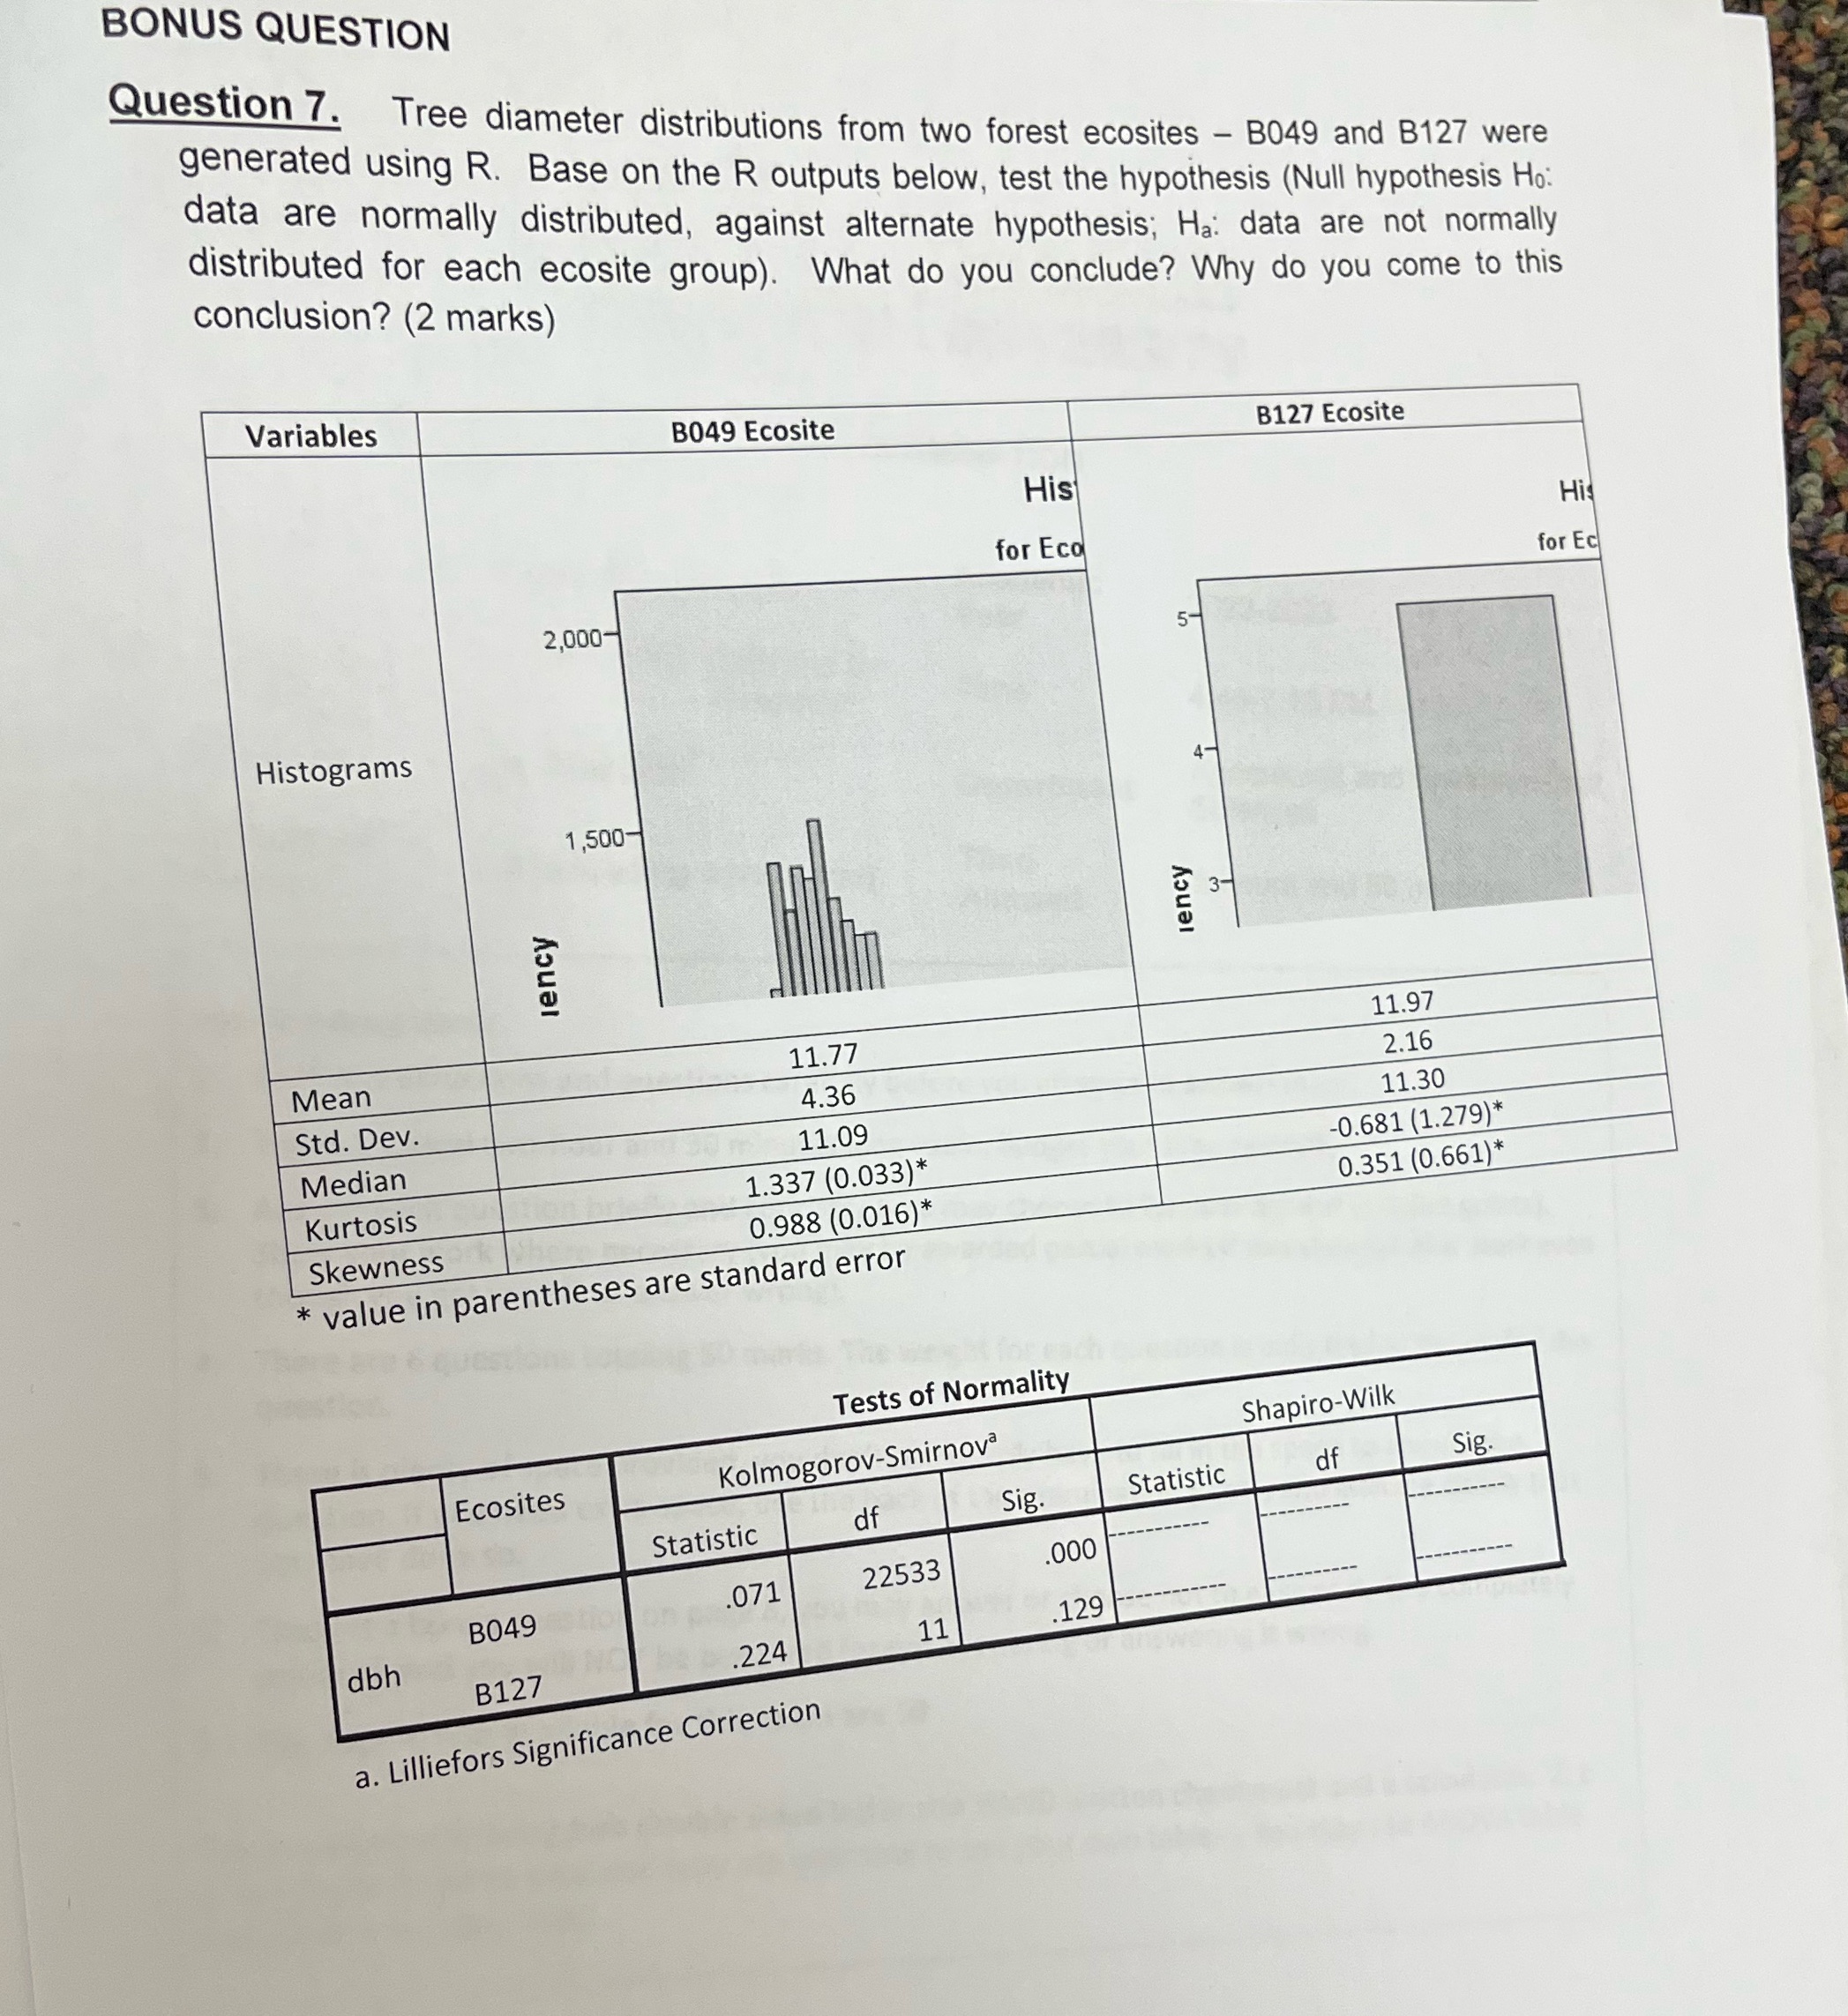
BONUS QUESTION Question 7. Tree diameter distributions from two forest ecosites - B049 and B127 were generated using R. Base on the R outputs below, test the hypothesis (Null hypothesis Ho: data are normally distributed, against alternate hypothesis; Ha: data are not normally distributed for each ecosite group). What do you conclude? Why do you come to this conclusion? (2 marks) Variables 8049 Ecosite B127 Ecosite His for Eco His for Ec 2,000- Histograms 1,500- lenc 3- Iency Mean 11.77 11.97 Std. Dev. 4.36 2.16 Median 11.09 11.30 Kurtosis 1.337 (0.033)* -0.681 (1.279) 0.351 (0.661)* Skewness 0.988 (0.016)* * value in parentheses are standard error Tests of Normality Shapiro-Wilk Ecosites Kolmogorov-Smirnov df Sig. Statistic df Sig. Statistic 000 B049 071 22533 dbh 11 129 B127 224 a. Lilliefors Significance Correction
Step by Step Solution
There are 3 Steps involved in it

Get step-by-step solutions from verified subject matter experts