

Question: Book information: Burke, S. E. (2017). The certified quality engineer handbook. 4th edition. Milwaukee, WI: ASQ Quality Press ISBN: 978-0-87389-944-4. 1. The manager of the
Book information:Burke, S. E. (2017). The certified quality engineer handbook.4th edition.Milwaukee, WI: ASQ Quality Press ISBN:978-0-87389-944-4.
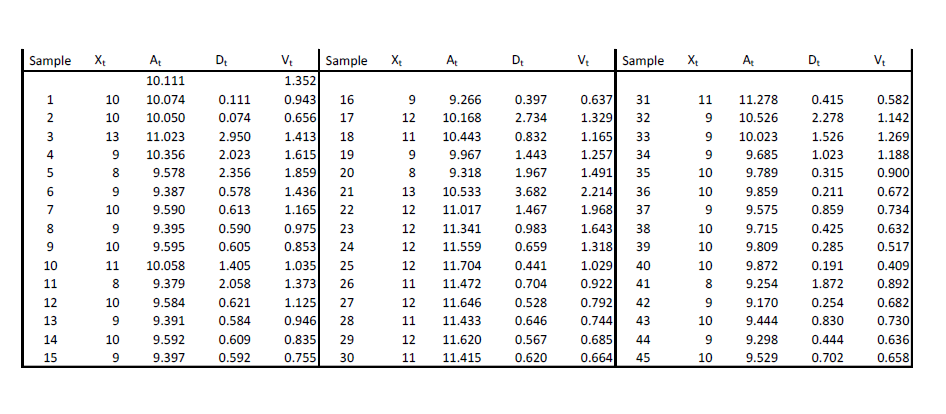
1. The manager of the injection molding department has asked you to prepare n EWMA chart for a maintenance operation-weekly mold changes. The table of data below shows the number of mold changes for the last 45 weeks. Construct EWMA charts using r = 0.33.
Find the: Calculate estimates of the process mean and standard deviation
Compute exponentially weighted moving averages, A_t, and exponentially weighted moving standard deviations, V_t
Calculated control limits and centerlines for A_t's and V_t's by (and A^*, d_2^*, D_1^*, and D_2^* given in Table 9.3
Create EWMA charts (weighed moving average and moving deviation chart)
Identify any statistical signals on the charts or other trendlike patterns. What can you report to the manager about the mold-changing process?
\f
Step by Step Solution
There are 3 Steps involved in it

Get step-by-step solutions from verified subject matter experts