Question: Bookmarks Profiles Tab Window Help O ot Com Bub X S [Snapshot]: Don't Put All Your | x G Mutual Fund - Google Search X
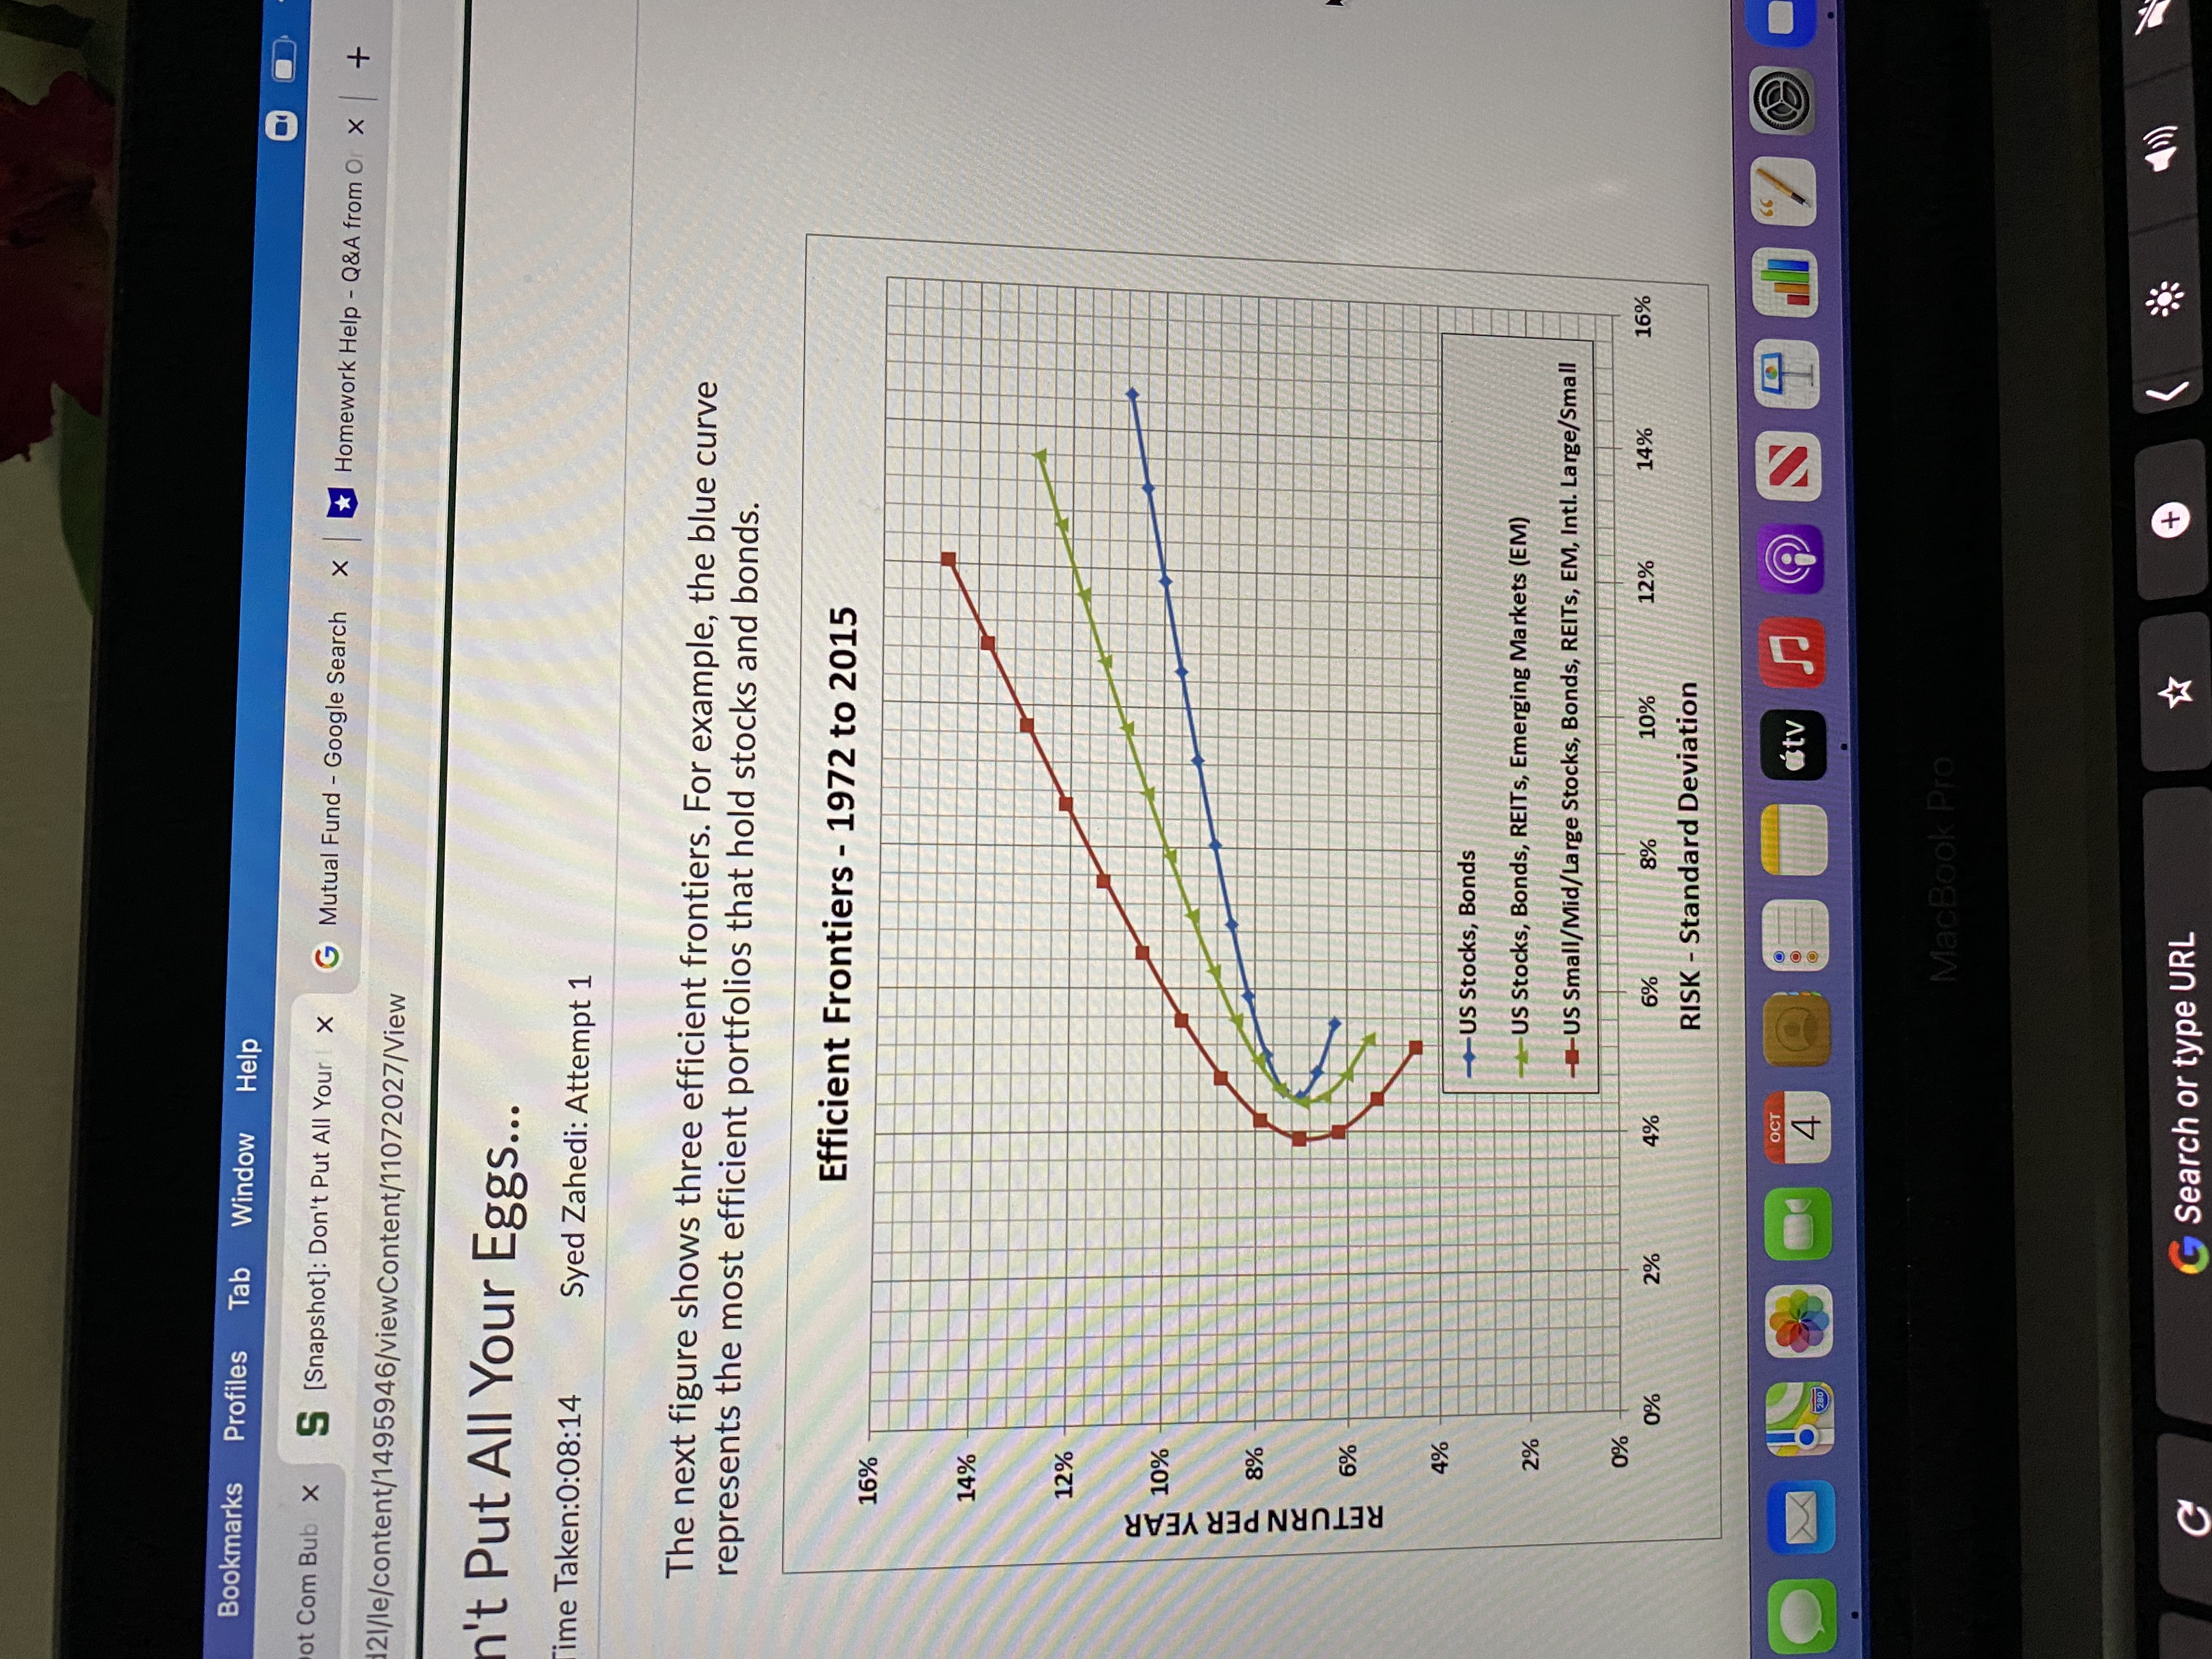
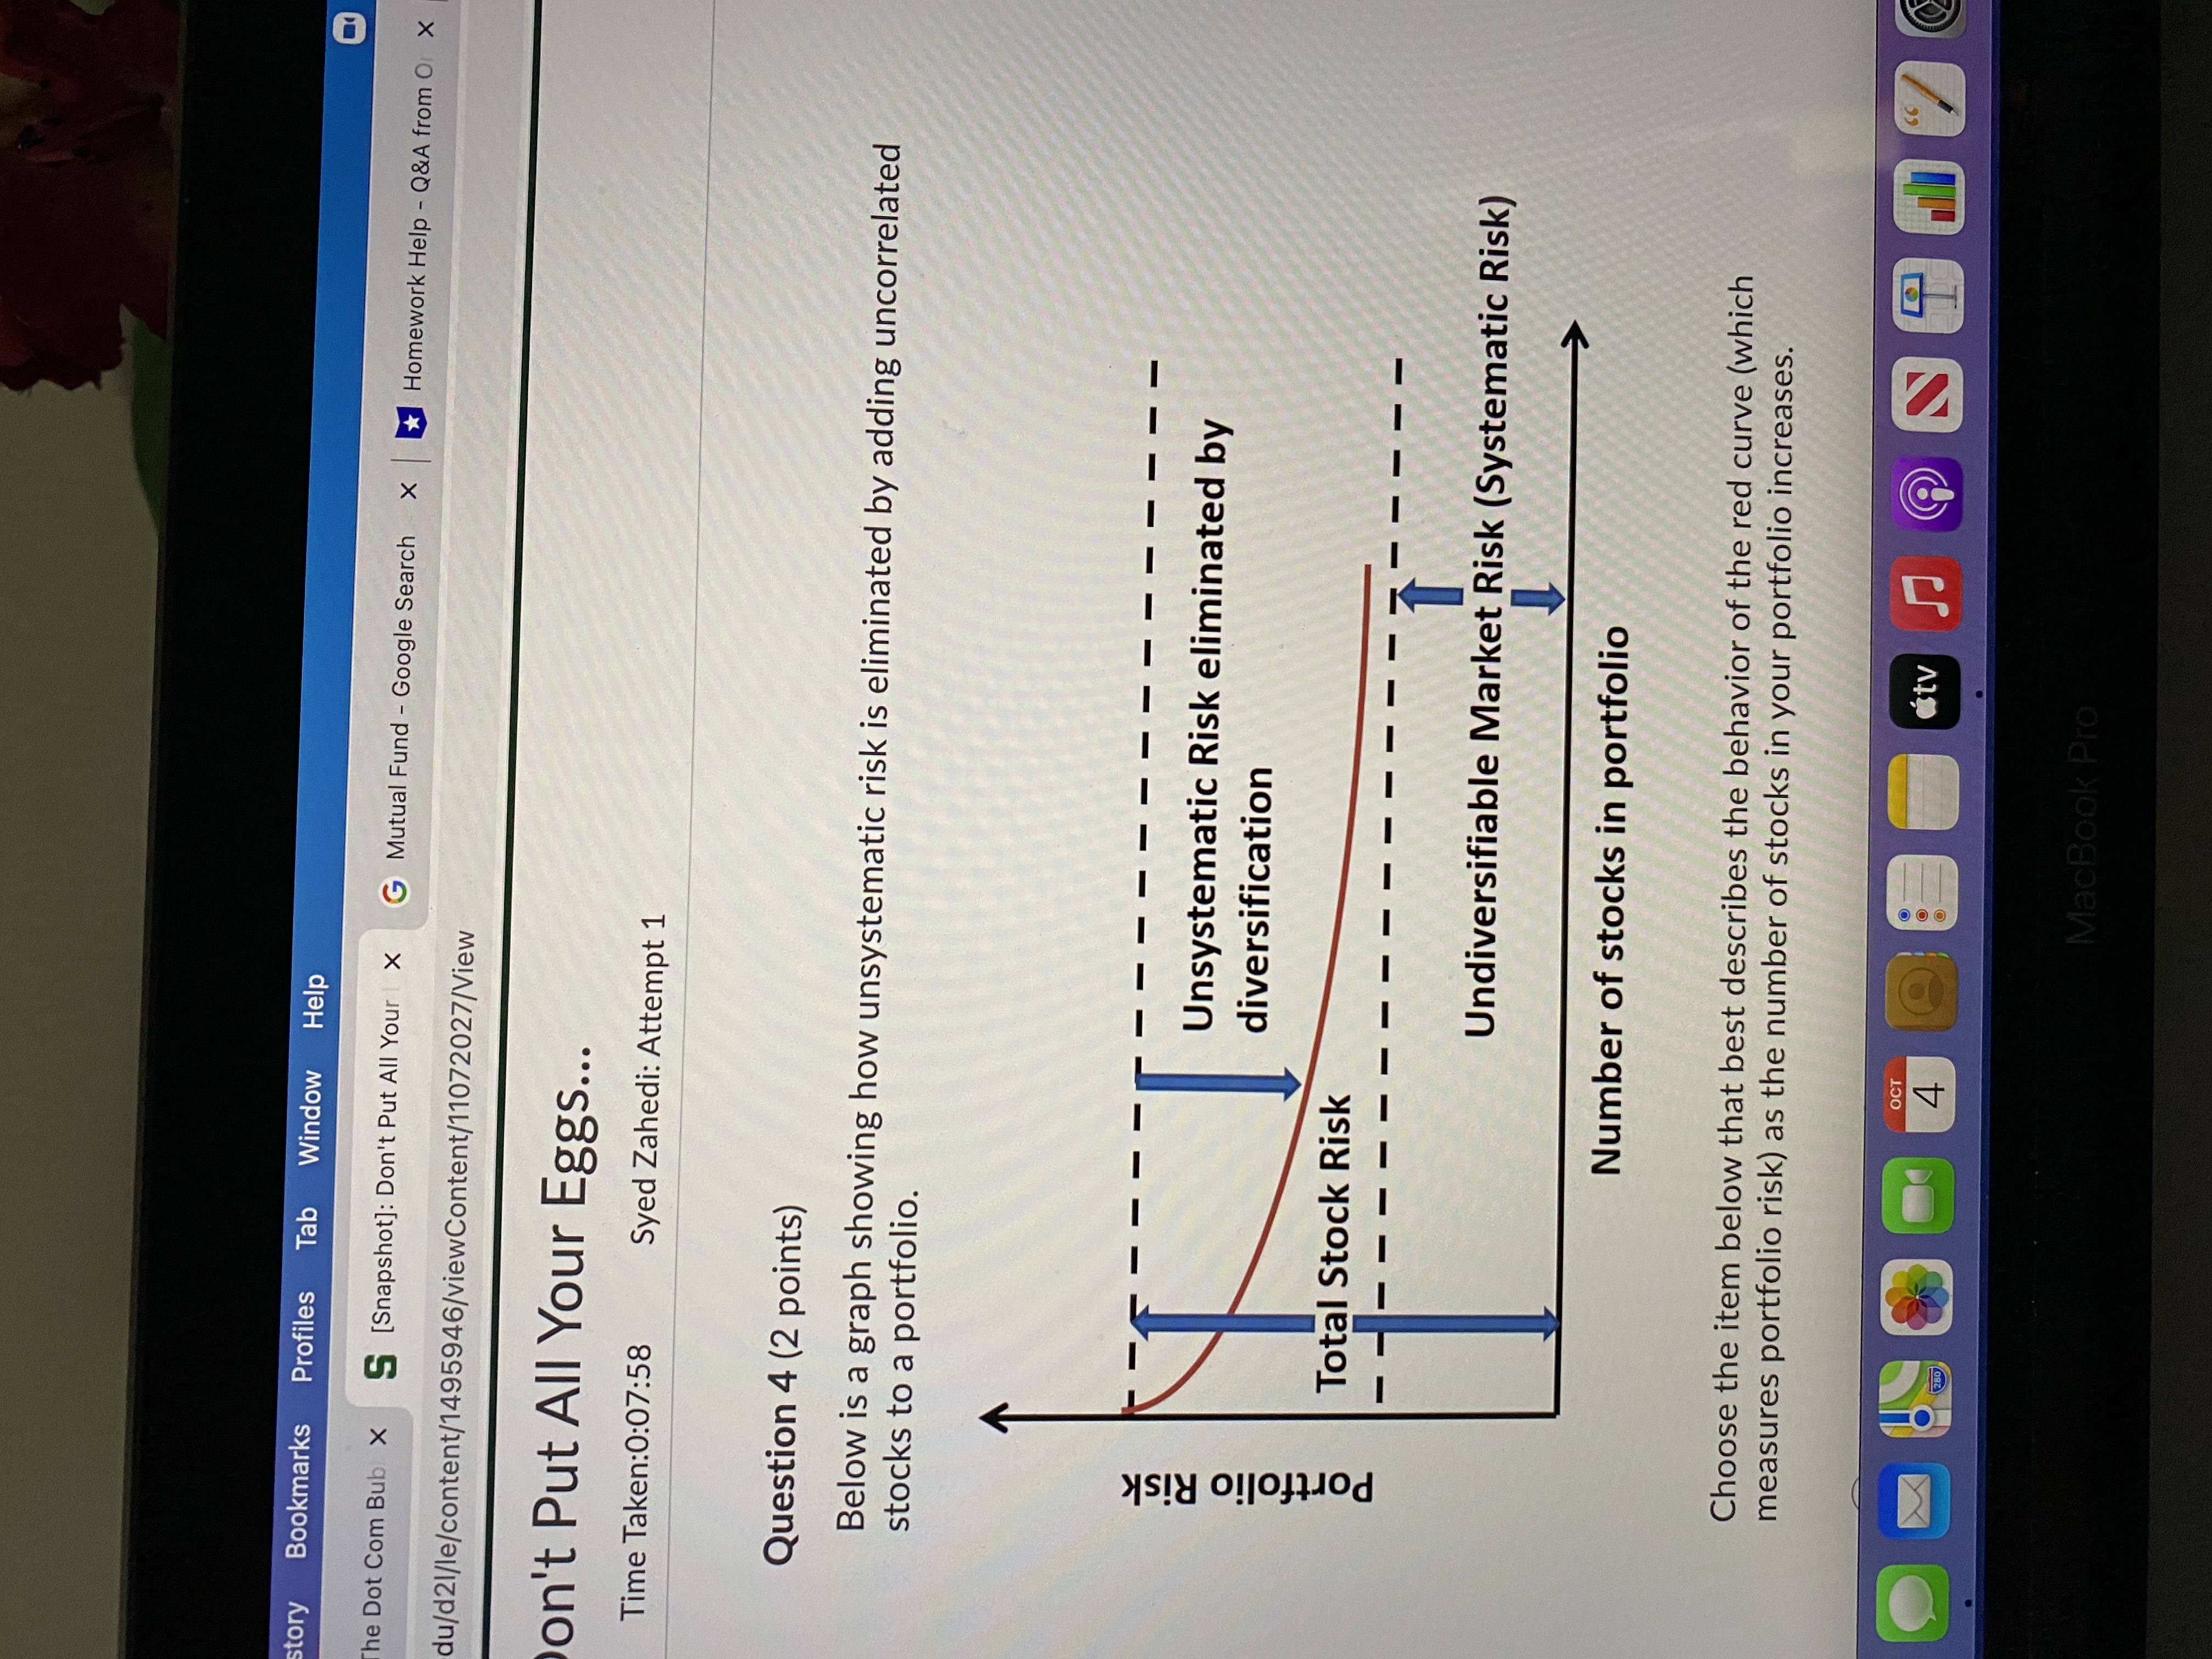
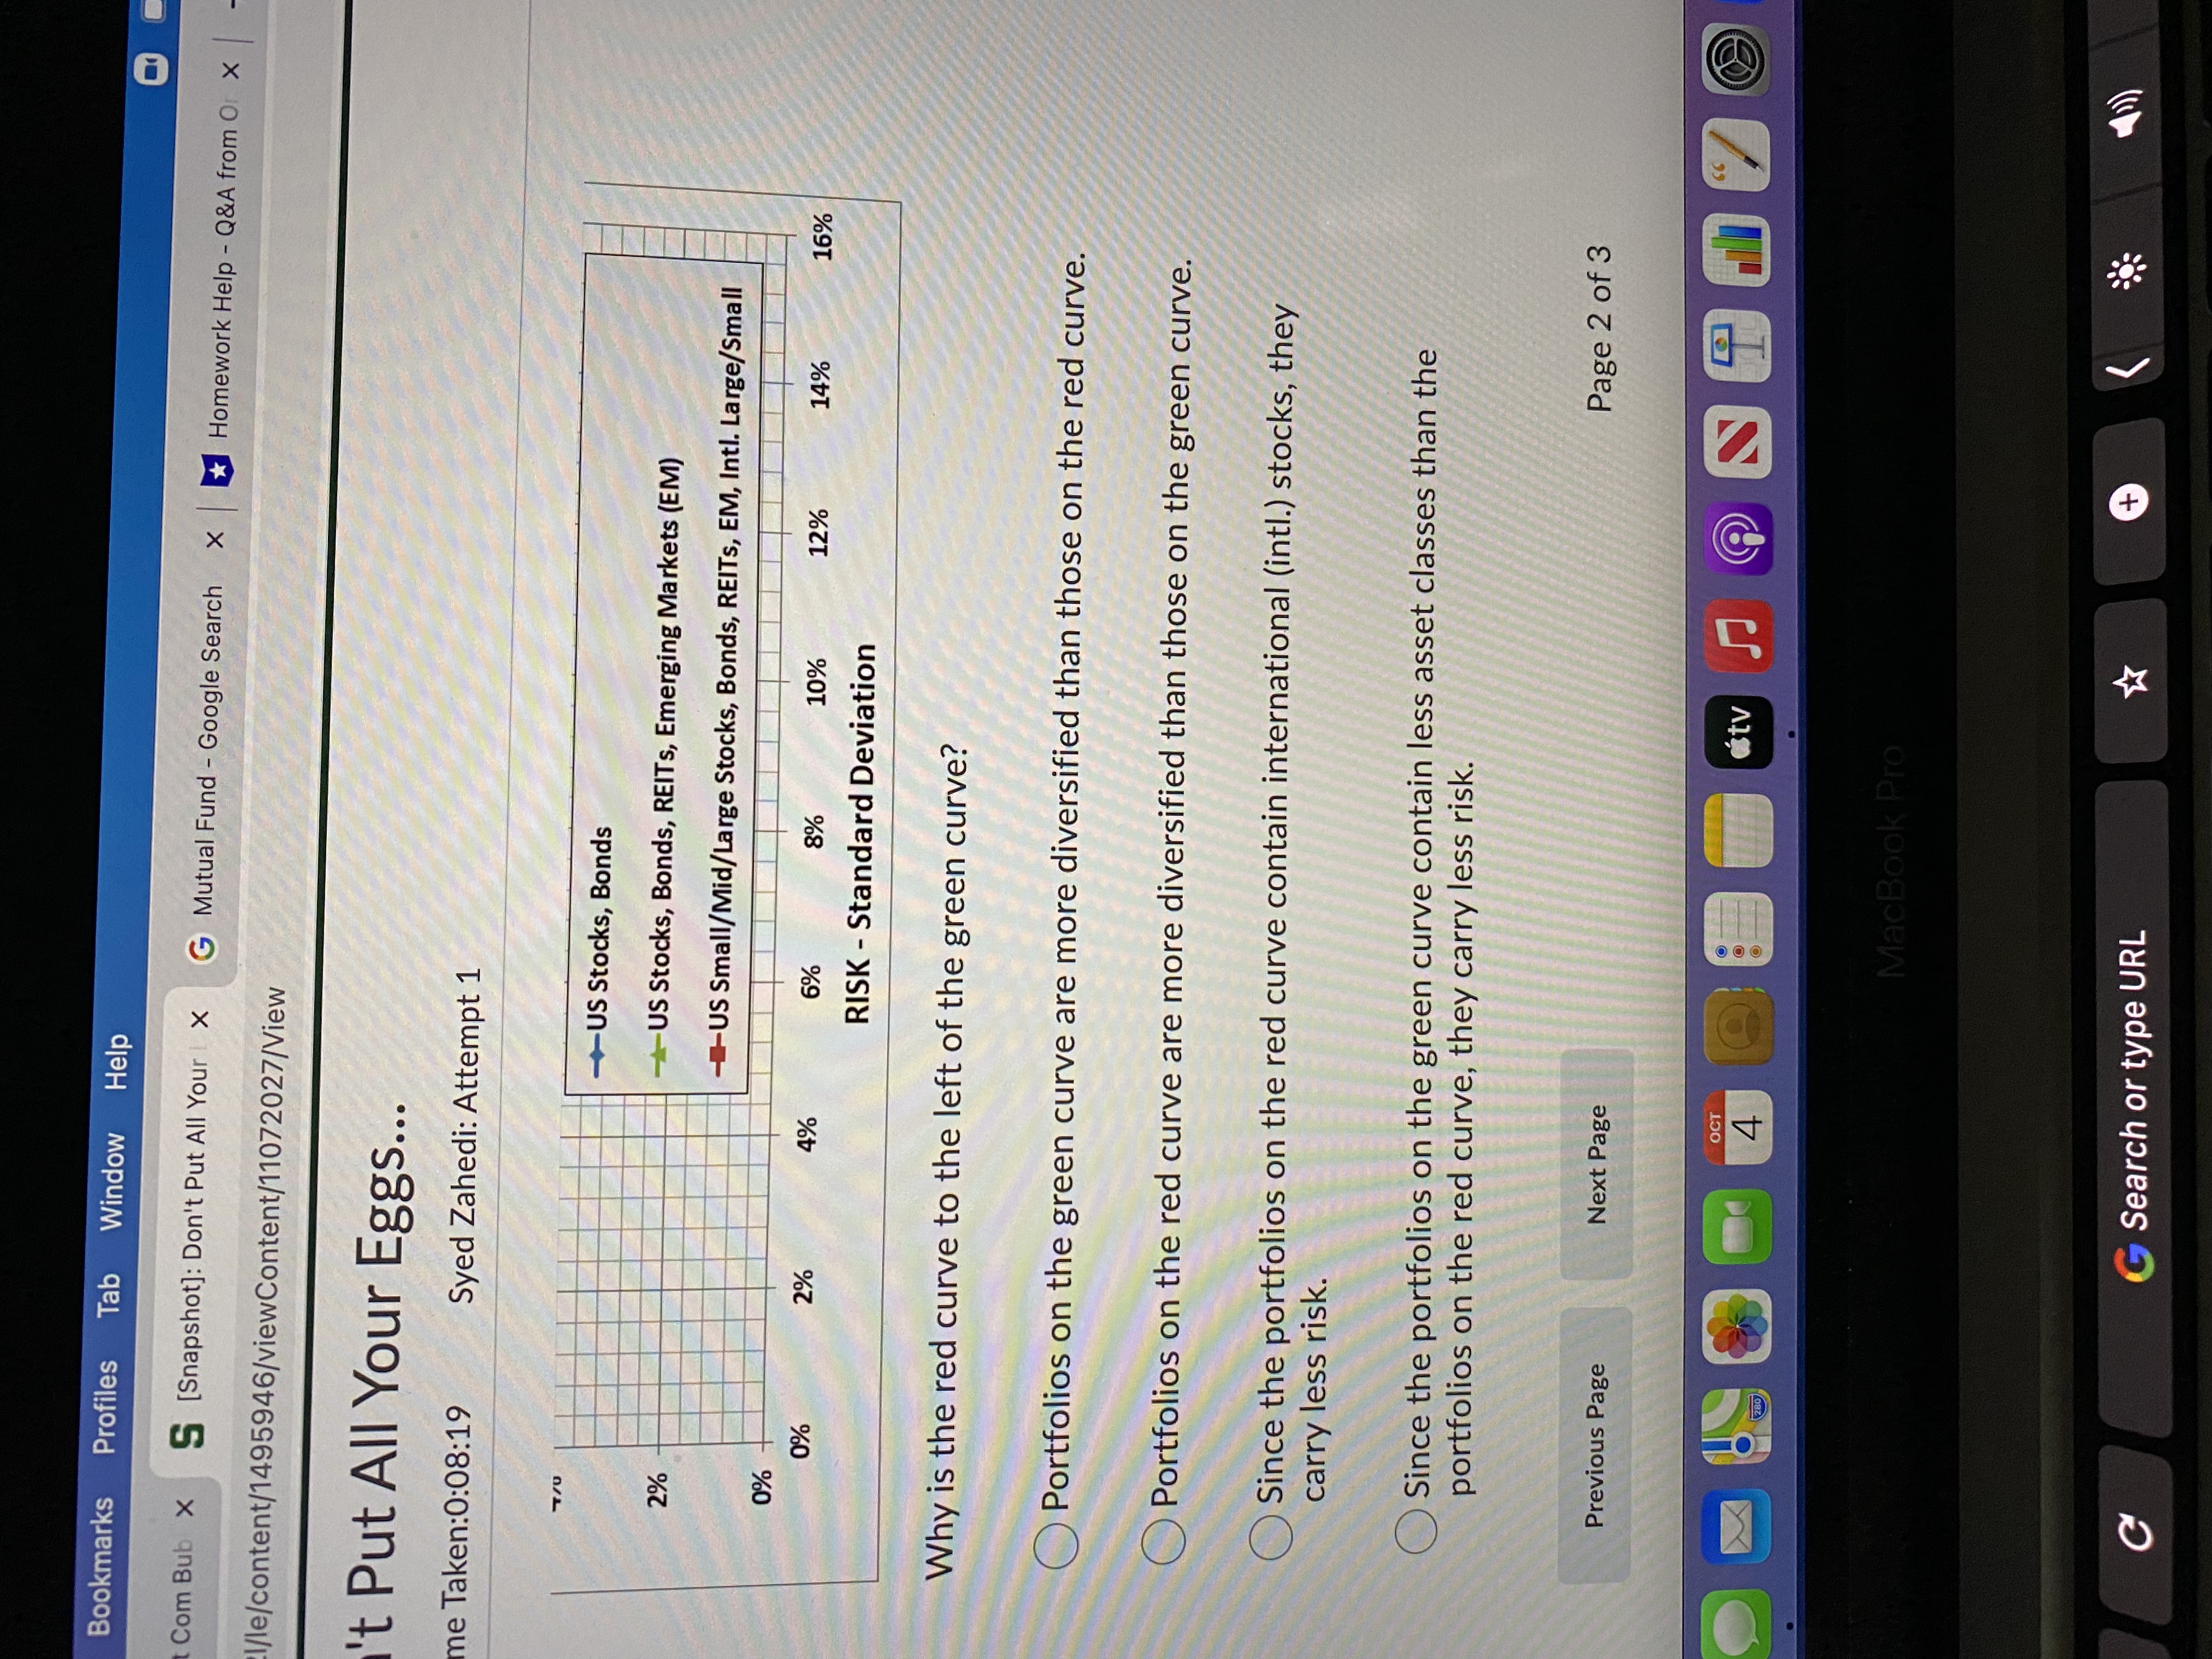
Bookmarks Profiles Tab Window Help O ot Com Bub X S [Snapshot]: Don't Put All Your | x G Mutual Fund - Google Search X Homework Help - Q&A from Or x + 21/le/content/1495946/viewContent/11072027/View n't Put All Your Eggs... ime Taken:0:08:14 Syed Zahedi: Attempt 1 The next figure shows three efficient frontiers. For example, the blue curve represents the most efficient portfolios that hold stocks and bonds. Efficient Frontiers - 1972 to 2015 16% 14% 12% 10% RETURN PER YEAR 8% 6% 4% US Stocks, Bonds US Stocks, Bonds, REITs, Emerging Markets (EM) 2% -US Small/Mid/Large Stocks, Bonds, REITs, EM, Intl. Large/Small 0% 12% 14% 16% 0% 2% 4% 6% 8% 10% RISK - Standard Deviation OCT 4 MacBook Pro + G Search or type URLstory Bookmarks Profiles Tab Window Help The Dot Com Bub X S [Snapshot]: Don't Put All Your | x G Mutual Fund - Google Search X Homework Help - Q&A from Or x du/d21/le/content/1495946/viewContent/11072027/View on't Put All Your Eggs... Time Taken:0:07:58 Syed Zahedi: Attempt 1 Question 4 (2 points) Below is a graph showing how unsystematic risk is eliminated by adding uncorrelated stocks to a portfolio. - - Unsystematic Risk eliminated by Portfolio Risk diversification Total Stock Risk - - - - - - - - - Undiversifiable Market Risk (Systematic Risk) Number of stocks in portfolio Choose the item below that best describes the behavior of the red curve (which measures portfolio risk) as the number of stocks in your portfolio increases. OCT 4 MacBook Protory Bookmarks Profiles Tab Window Help he Dot Com Bub x S [Snapshot]: Don't Put All Your | x G Mutual Fund - Google Search X Homework Help - Q&A from Or x lu/d21/le/content/1495946/viewContent/11072027/View on't Put All Your Eggs... Time Taken:0:07:42 Syed Zahedi: Attempt 1 Each possible selection below is a pair of things that are either positively correlated, negatively correlated, or uncorrelated. For example, hot days and ice cream sales on those days are positively correlated. Select all pairs of things that are negatively correlated. Hot days and ice cream sales on those days. Risk and return. Dividend yield and stock price. How long your hair is, and the temperature in Wuxi, China. The speed you drive your car from point A to point B, and the time it takes you to get there. The number of absences you have in a class, and your grade. Two stocks in an well-diversified portfolio. A company's stock price and its market cap (assuming the number of shares outstanding is fixed). OCT itv 4 MacBook ProBookmarks Profiles Tab Window Help Com Bub x S [Snapshot]: Don't Put All Your | X G Mutual Fund - Google Search X Homework Help - Q&A from Or x 1/le/content/1495946/viewContent/11072027/View 't Put All Your Eggs... me Taken:0:08:19 Syed Zahedi: Attempt 1 7/ -US Stocks, Bonds 2% US Stocks, Bonds, REITs, Emerging Markets (EM) -US Small/Mid/Large Stocks, Bonds, REITs, EM, Intl. Large/Small 0% 0% 2% 4% 6% 8% 10% 12% 14% 16% RISK - Standard Deviation Why is the red curve to the left of the green curve? Portfolios on the green curve are more diversified than those on the red curve. Portfolios on the red curve are more diversified than those on the green curve. Since the portfolios on the red curve contain international (intl.) stocks, they carry less risk. Since the portfolios on the green curve contain less asset classes than the portfolios on the red curve, they carry less risk. Previous Page Next Page Page 2 of 3 OCT 4 tv MacBook Pro + C G Search or type URLHistory Bookmarks Profiles Tab Window Help s]: The Dot Com Bub x S [Snapshot]: Don't Put All Your ( X G Mutual Fund - Google Search X Homework Help - Q&A from O su.edu/d21/le/content/1495946/viewContent/11072027/View Don't Put All Your Eggs... Time Taken:0:07:06 Syed Zahedi: Attempt 1 Previous Page Next Page Page 1 of 3 Question 1 (3 points) Order the investments below from 1 to 4, with the investment labeled "1" being the riskiest and the investment labeled "4" being the safest. Foreign Stocks U.S. Government Bonds U.S. Stocks Fixed-Income Bank Account Previous Page Next Page Page 1 of 3 Submit Quiz of 8 questions saved OCT 4 tv MacBook ProBookmarks Profiles Tab Window Help ot Com Bub X S [Snapshot]: Don't Put All Your X G Mutual Fund - Google Search X Homework Help - Q&A from Or x 21/le/content/1495946/viewContent/11072027/View 't Put All Your Eggs... me Taken:0:08:31 Syed Zahedi: Attempt 1 Previous Page Next Page Page 3 of 3 Question 6 (1 point) Imagine you work at Starbucks as a barista, and you make $52 per hour. If you make $1080 per week, which equation below describes your weekly income "I" (in dollars) in terms of the number "t" of weeks you have worked? 1 = 1080 + t 1 = 1080t OI = 52t 1 = 520t
Step by Step Solution
There are 3 Steps involved in it
1 Expert Approved Answer
Step: 1 Unlock
Question Has Been Solved by an Expert!
Get step-by-step solutions from verified subject matter experts
Step: 2 Unlock
Step: 3 Unlock
Students Have Also Explored These Related Mathematics Questions!