

Question: Bottle Sample 1 2 3 4 1 0.586 0.589 0.605 0.581 2 0.583 0.611 0.616 0.594 3 0.575 0.580 0.588 0.597 4 0.614 0.620 0.602
Bottle Sample 1 2 3 4 1 0.586 0.589 0.605 0.581 2 0.583 0.611 0.616 0.594 3 0.575 0.580 0.588 0.597 4 0.614 0.620 0.602 0.585 5 0.616 0.613 0.584 0.621 6 0.588 0.621 0.589 0.587
Please show me how to calculate in excel
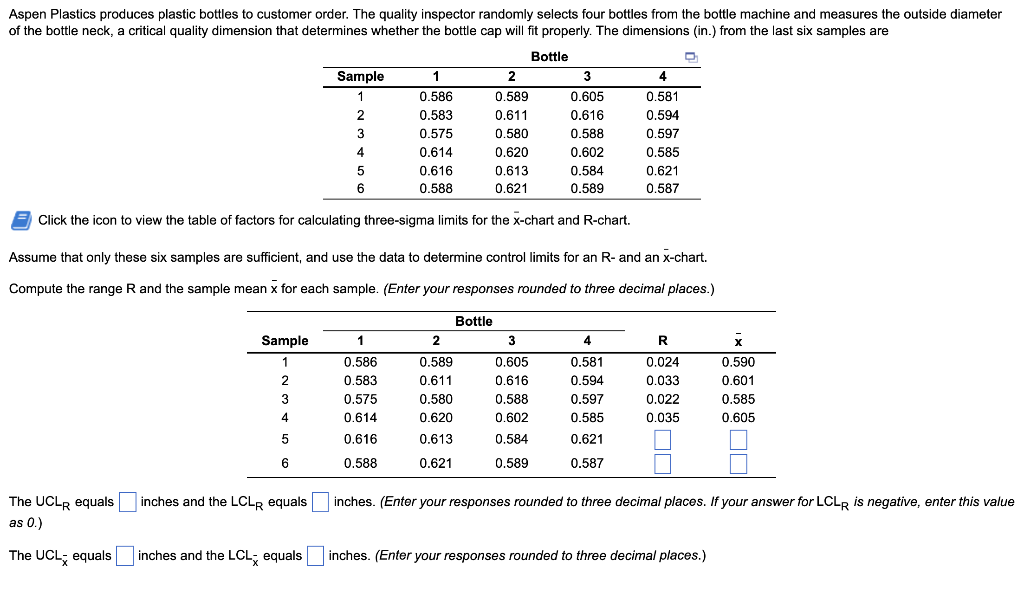
Aspen Plastics produces plastic bottles to customer order. The quality inspector randomly selects four bottles from the bottle machine and measures the outside diameter of the bottle neck, a critical quality dimension that determines whether the bottle cap will fit properly. The dimensions (in.) from the last six samples are Bottle Sample 1 2 3 4 4 1 0.586 0.589 0.605 0.581 2 0.583 0.611 0.616 0.594 3 3 0.575 0.580 0.588 0.597 4 0.614 0.620 0.602 0.585 5 0.616 0.613 0.584 0.621 6 0.588 0.621 0.589 0.587 Click the icon to view the table of factors for calculating three-sigma limits for the x-chart and R-chart. Assume that only these six samples are sufficient, and use the data to determine control limits for an R- and an X-chart. Compute the range R and the sample mean x for each sample. (Enter your responses rounded to three decimal places.) 1 4 Sample 1 2 3 0.586 0.583 0.575 0.614 0.616 Bottle 2 3 0.589 0.605 0.611 0.616 0.580 0.588 0.620 0.602 0.613 0.584 0.581 0.594 0.597 0.585 R 0.024 0.033 0.022 0.035 x 0.590 0.601 0.585 0.605 4 5 0.621 6 0.588 0.621 0.589 0.587 inches and the LCLR equals inches. (Enter your responses rounded to three decimal places. If your answer for LCLR is negative, enter this value The UCLR equals as 0.) The UCL; equals inches and the LCL, equals inches. (Enter your responses rounded to three decimal places.)Step by Step Solution
There are 3 Steps involved in it
1 Expert Approved Answer
Step: 1 Unlock

Question Has Been Solved by an Expert!
Get step-by-step solutions from verified subject matter experts
Step: 2 Unlock
Step: 3 Unlock