

Question: Box Plot LINE 1, LINE 2, LINE 3 Data LINE 1 LINE 2 LINE 3 The following data represents the equipment downtime per week for

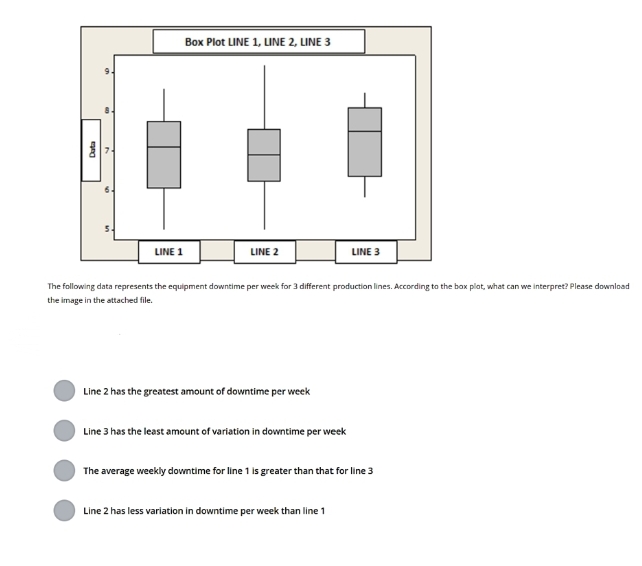
Box Plot LINE 1, LINE 2, LINE 3 Data LINE 1 LINE 2 LINE 3 The following data represents the equipment downtime per week for 3 different production lines. According to the box plot, what can we interpret? Please download the image in the attached file. Line 2 has the greatest amount of downtime per week Line 3 has the least amount of variation in downtime per week The average weekly downtime for line 1 is greater than that for line 3 Line 2 has less variation in downtime per week than line 1
Step by Step Solution
There are 3 Steps involved in it
1 Expert Approved Answer
Step: 1 Unlock

Question Has Been Solved by an Expert!
Get step-by-step solutions from verified subject matter experts
Step: 2 Unlock
Step: 3 Unlock