

Question: Break-even Analysis The visualization in this exercise represents a break-even analysis for Pops Planes., a small passenger airline, catering to tourists travelling between Hawailan islands.
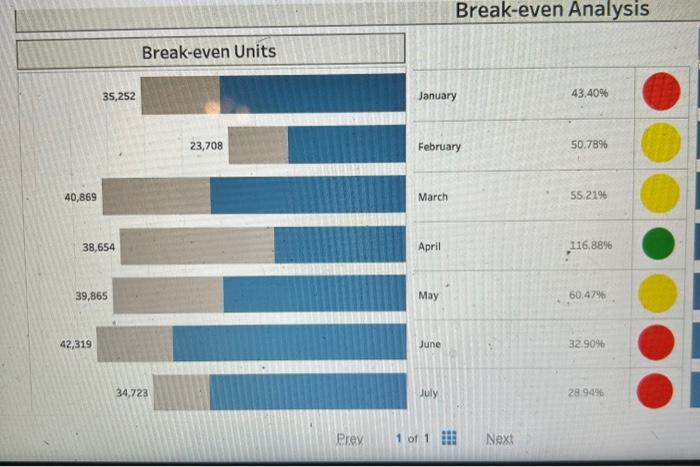
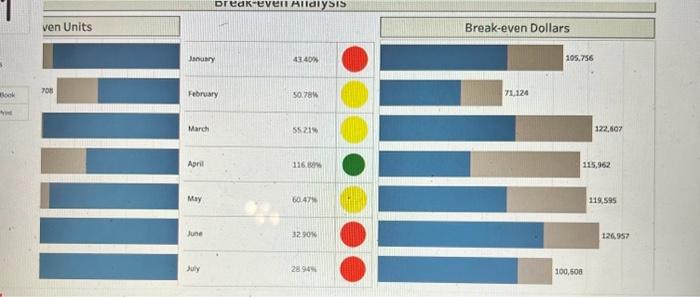
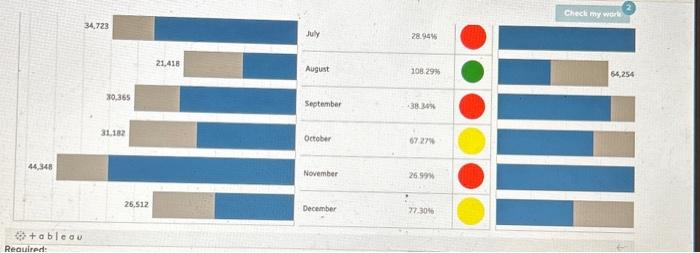
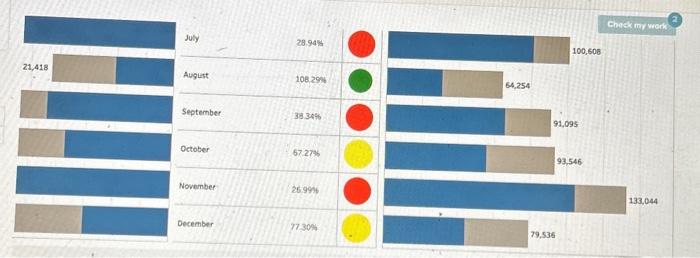
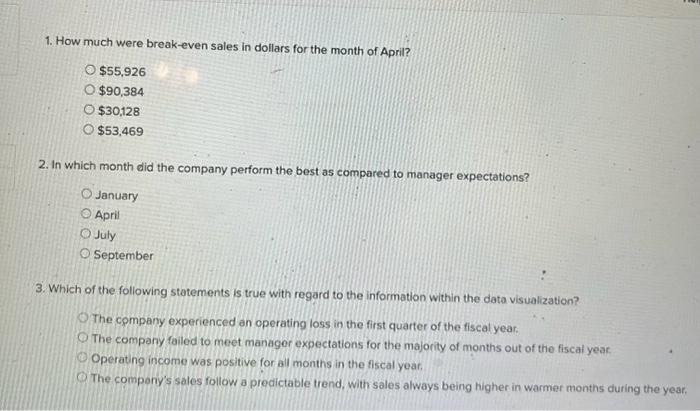
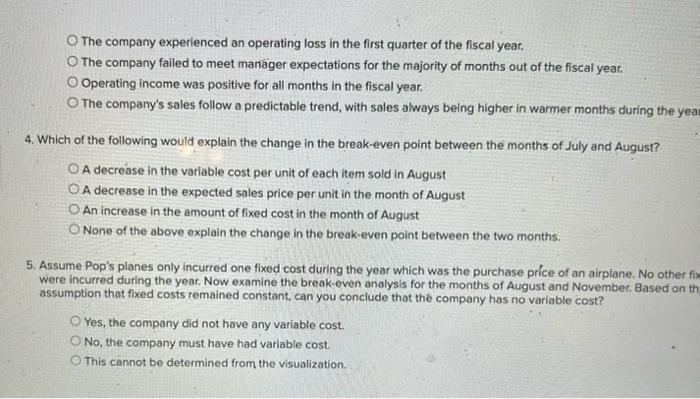
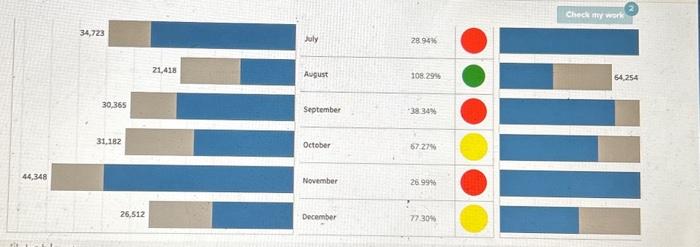
Break-even Analysis The visualization in this exercise represents a break-even analysis for Pops Planes., a small passenger airline, catering to tourists travelling between Hawailan islands. The break-even analysis shows the number of passengers (units) in the left column and sales dollars in the right column for each month of the fiscal year. The blue portion of the bar charts represents th number of units (left) or dollars (right) required each month to break even while the grey portion represents the actual units or dollars sold each month. The percentage values in the center represent the extent to which actual sales exceeded break-eve sales. Finally, the center column compares actual sales to break-even sales based on company management expectations as follows: - Not meeting or exceeding break-even sales of less than 50% is below expectations fred dot). - Exceeding break-even sales from 50% to 100% is meeting expectations (yellow dot). - Exceeding break-even sales greater than 100% is oxceeding expectations (green dot). Use the infprmation in the dashboard to answer the following questions. Break-even Analysis Break-even Units 35,252 January 43.40% 23,708 February 50.78% 40,869 March 55.2196 38,654 April 116.88% 39,865 May 60.47% 42,319 June 32.90% 34,723 July 28.94% Prey 1 of 1 Next The company experienced an operating loss in the first quarter of the fiscal year. The company failed to meet manager expectations for the majority of months out of the fiscal year. Operating income was positive for all months in the fiscal year. The company's sales follow a predictable trend, with sales always being higher in warmer months during the yea 4. Which of the following would explain the change in the break-even point between the months of July and August? A decrease in the variable cost per unit of each item sold in August A decrease in the expected sales price per unit in the month of August An increase in the amount of fixed cost in the month of August None of the above explain the change in the break-even point between the two months. 5. Assume Pop's planes only incurred one fixed cost during the year which was the purchase price of an airplane. No other f were incurred during the year. Now examine the break-even analysis for the months of August and November. Based on th assumption that fixed costs remained constant, can you conclude that the company has no variable cost? Yes, the company did not have any variable cost. No, the company must have had variable cost. This cannot be determined from the visualization. 1. How much were break-even sales in dollars for the month of April? $55,926 $90,384 $30,128 $53,469 2. In which month did the company perform the best as compared to manager expectations? January April July September 3. Which of the following statements is true with regard to the information within the data visualization? The company experienced an operating loss in the first quarter of the fiscal year. The company failed to meet manager expectations for the majority of months out of the fiscal year: Operating income was positive for all months in the fiscal year. The compony's sales follow a predictable trend, with sales always being higher in warmer months during the year
Step by Step Solution
There are 3 Steps involved in it

Get step-by-step solutions from verified subject matter experts