

Question: breast = read. file. choose ( ) , header = TRUE ) attach ( breast ) model 2 = glm ( as . factor (
breastread. file. choose headerTRUE
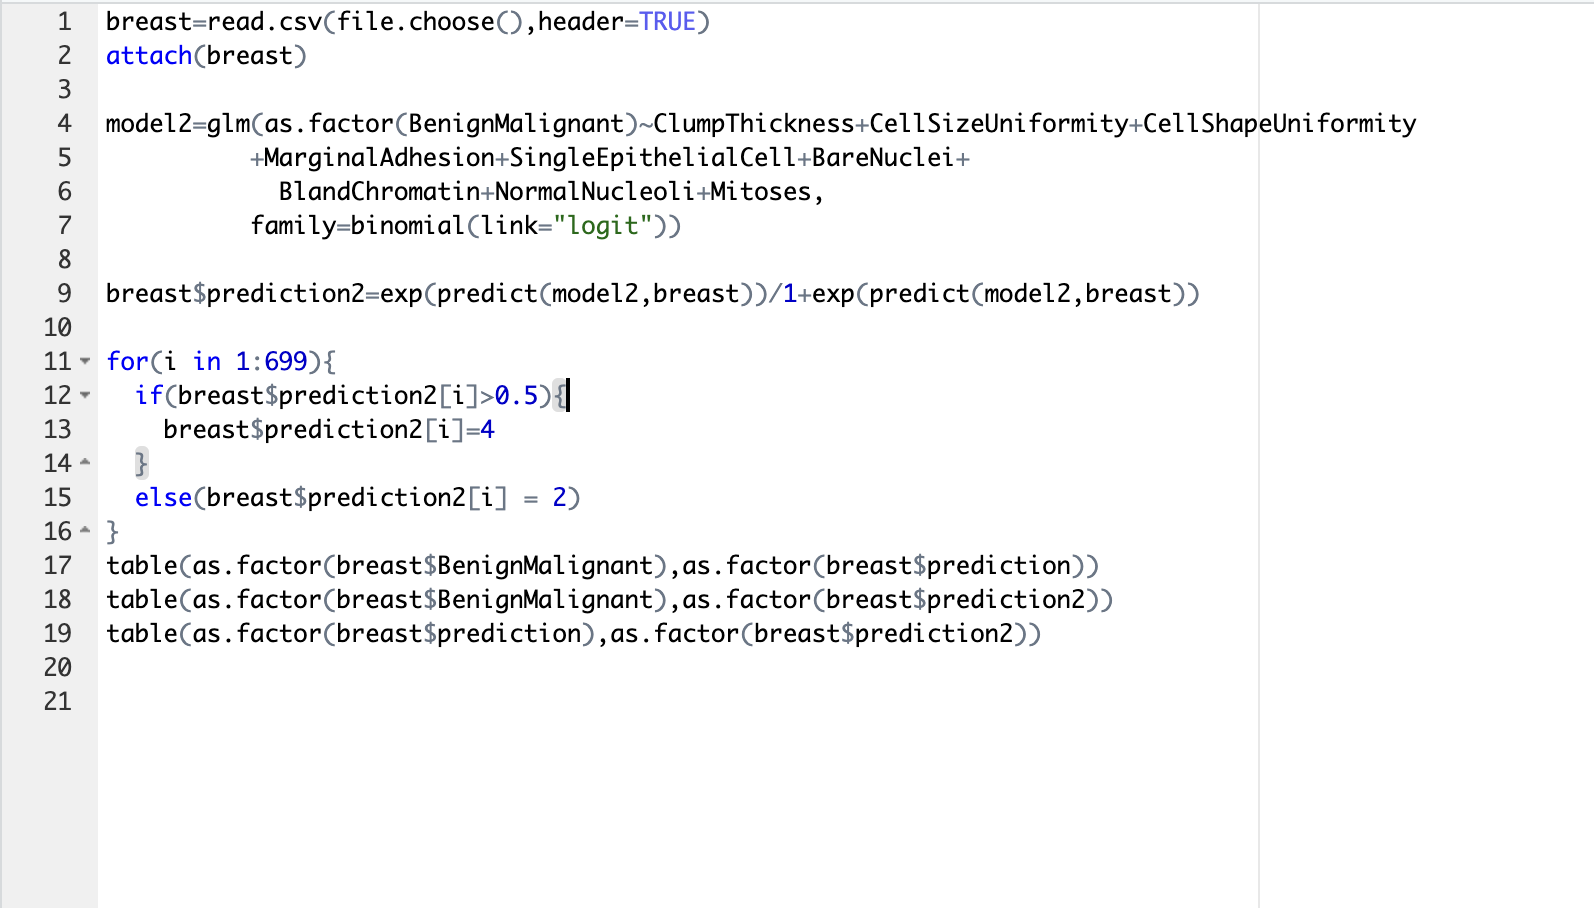
attachbreast
modelglmas factorBenignMalignant ClumpThicknessCellSizeUniformityCellShapeUniformity
MarginalAdhesionSingleEpithelialCellBareNuclei
BlandChromatinNormalNucleoliMitoses,
familybinomiallink"logit"
breast$predictionexppredictmodelbreastexppredictmodelbreast
fori in :
ifbreast$prediction
breast$prediction
elsebreast$predictioni
tableasfactorbreast$BenignMalignant asfactorbreast$prediction
tableasfactorbreast$BenignMalignant as factorbreast$prediction
tableas factorbreast$prediction as factorbreast$prediction
Your goal is to write a script in R that will take the x table in R for your logistic regression results in HW and use it to derive those measurements.
Step by Step Solution
There are 3 Steps involved in it
1 Expert Approved Answer
Step: 1 Unlock

Question Has Been Solved by an Expert!
Get step-by-step solutions from verified subject matter experts
Step: 2 Unlock
Step: 3 Unlock