

Question: Briefly explain the line graph below for Exhibit 3, Exhibit 4 and Exhibit 5. Exhibit 3 Exhibit 4 Exhibit 5 Monetary Policy and the Federal
Briefly explain the line graph below for Exhibit 3, Exhibit 4 and Exhibit 5.
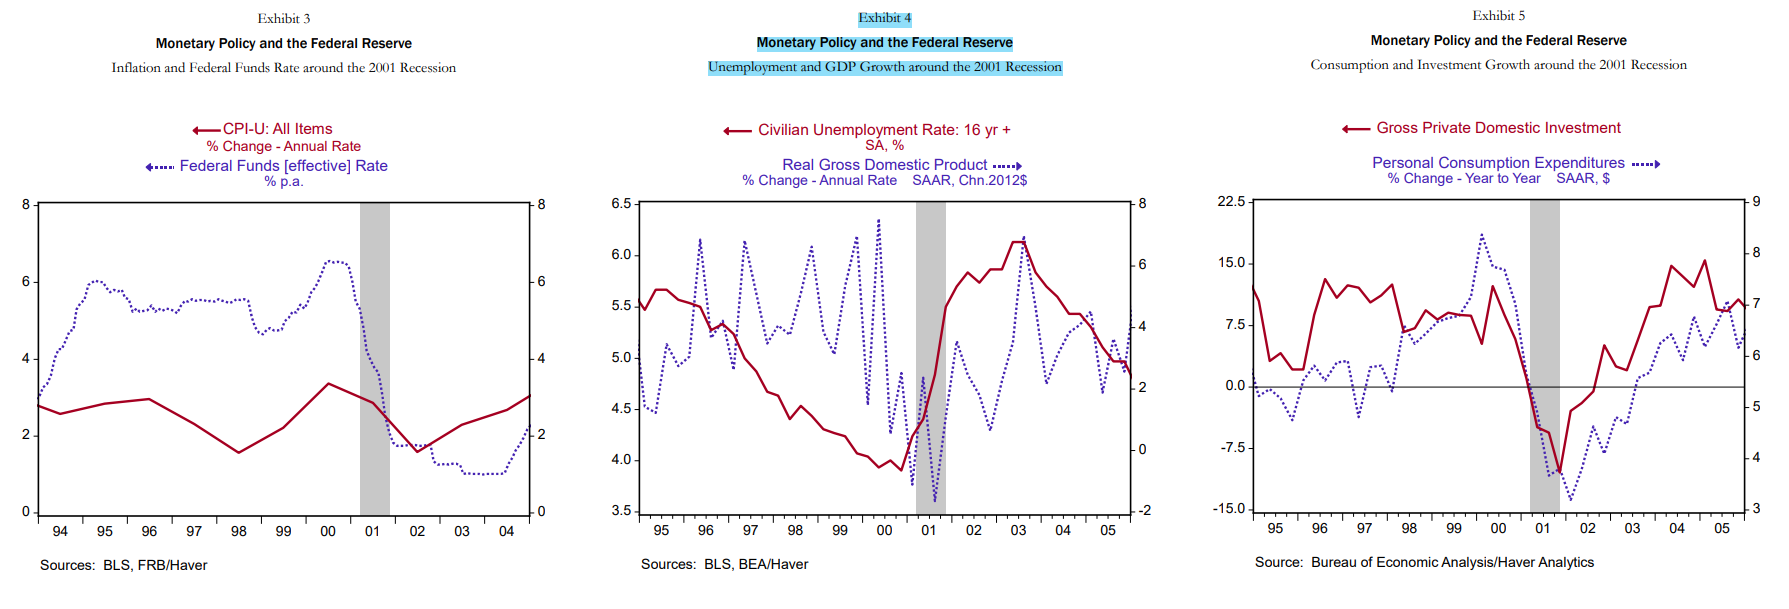
Exhibit 3 Exhibit 4 Exhibit 5 Monetary Policy and the Federal Reserve Monetary Policy and the Federal Reserve Monetary Policy and the Federal Reserve Inflation and Federal Funds Rate around the 2001 Recession Unemployment and GDP Growth around the 2001 Recession Consumption and Investment Growth around the 2001 Recession +CPI-U: All Items * Civilian Unemployment Rate: 16 yr + + Gross Private Domestic Investment % Change - Annual Rate SA, % 4.*" Federal Funds [effective] Rate Real Gross Domestic Product ... Personal Consumption Expenditures . % p.a. % Change - Annual Rate SAAR, Chn.2012$ % Change - Year to Year SAAR, $ 8 8 6.5 8 22.5 6.0 6 15.0- 6. 6 5.5 - 7.5 ...... i...s... 4 6.0- 6 ............ 2 0.0 4.5 - 5 2 0 -7.5 4.0 4 3.5 -2 -15.0 TTT .3 94 95 96 97 98 99 00 01 02 03 04 95 96 97 98 99 00 01 02 03 04 05 95 96 97 98 99 00 01 02 03 04 05 Sources: BLS, FRB/Haver Sources: BLS, BEA/Haver Source: Bureau of Economic Analysis/Haver Analytics
Step by Step Solution
There are 3 Steps involved in it

Get step-by-step solutions from verified subject matter experts