Question: BUAD 360-D1 Project I: Regression Analysis Please use the attached dataset (separate Excel file) to analyze the relationship between selling price of houses and each
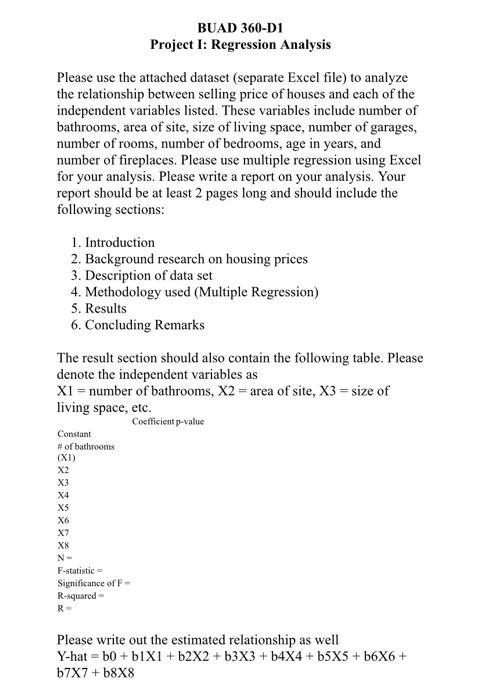
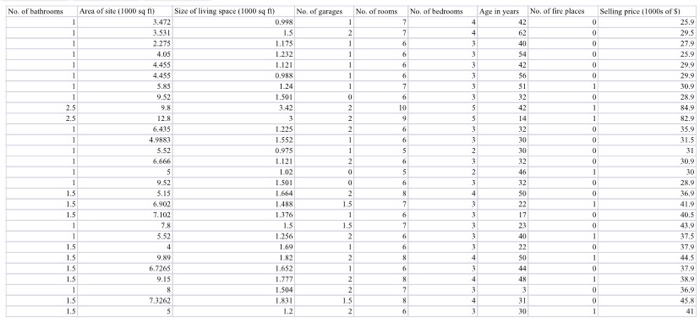
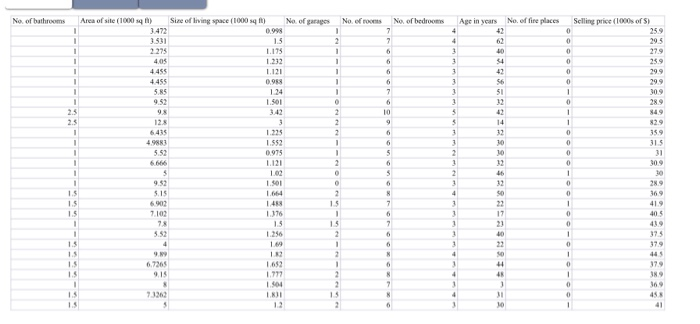
BUAD 360-D1 Project I: Regression Analysis Please use the attached dataset (separate Excel file) to analyze the relationship between selling price of houses and each of the independent variables listed. These variables include number of bathrooms, area of site, size of living space, number of garages, number of rooms, number of bedrooms, age in years, and number of fireplaces. Please use multiple regression using Excel for your analysis. Please write a report on your analysis. Your report should be at least 2 pages long and should include the following sections: 1. Introduction 2. Background research on housing prices 3. Description of data set 4. Methodology used (Multiple Regression) 5. Results 6. Concluding Remarks The result section should also contain the following table. Please denote the independent variables as X1 = number of bathrooms, X2 = area of site, X3 = size of living space, etc. Coefficient p-value Constant # of bathrooms (XI) X2 X3 X4 XS X6 X7 X8 N- F-statistic Significance of F- R-squared R- Please write out the estimated relationship as well Y-hat=b0+ b1X1 + b2X2 + b3X3 + b4X4 + b5X5 + b6X6 + b7X7+b8X8 No. of bathrooms No. of garages No. of fire places Age in years 42 4 1 . No. of rooms No. of hedreams 2 7 6 1 1 Size of living space (1000 sqm) 0.99% 1.5 1.175 1.232 L121 0.95% 1.24 1.501 142 1 2 1 1 1 1 1 4 3 3 3 3 40 54 . 1 Area of sile 1000 m 3.472 3.531 2.275 4.00 4.455 4.455 5.85 9.52 98 128 6.415 + 5.52 6 6 3 3 7 6 10 9 56 51 32 42 5 S 6 2 2 2 1 1 2 0 3 6 S 6 5 6 2 3 1 1 2.5 2.5 1 1 1 1 1 1 1.5 1.5 1.5 1 1 1.5 1.5 1.5 1.5 5 1.225 1.552 0.975 1121 1.02 1.501 1.664 1.488 1.376 1.5 1.256 1.60 Selling price 1000s of S) 0 25.9 0 29.5 0 27,9 0 25.9 0 29.9 0 29,9 1 10.9 0 1 84,9 1 82.9 0 35.9 0 31.5 0 0 30.9 1 20 O 28.9 0 36,9 1 41.9 0 40.5 0 1 37.5 0 37.9 1 445 0 37.9 1 $8.9 0 36,9 O 4. 1 30 30 32 46 32 SO 22 17 23 3 4 8 7 6 2 15 1 15 2 1 7 5.15 6902 7.100 7.8 5.52 4 99 6.7266 9.15 8 7.3262 5 0 6 X 3 3 5 3 4 40 22 SO 44 3 1.652 1.777 1.504 1x31 1.2 NNN 6 8 7 4 3 48 3 31 30 4 1.5 1.5 No. of bathrooms Area of site (1000 sq ft) Size of living space (1000 sq ft) 1 3.472 0.998 1 3531 1.5 1 2.275 1.175 1 4.05 1.232 1 4.455 1.121 ! 4455 0.958 1 5.85 1.24 1 9.52 1.501 25 98 225 128 3 1 6.435 1.225 ! 4.983 1.552 . 5.52 0975 1 66 1.121 1 5 1.02 1 9.52 1.501 1.5 5.15 1.664 1.5 1.5 7.102 1.176 1 1.5 1 5.52 1.256 1.3 4 1.69 1.5 182 1.5 1652 1.5 9.15 1.772 1 1.504 1.5 7.3262 LJI 1.5 5 12 No of garages No ofron No. of bedrooms 1 7 2 7 1 6 1 6 1 6 ! 6 1 7 0 6 2 10 2 9 6 1 6 1 5 2 6 5 Age in years No. of fire places 4 42 4 62 10 3 $4 3 42 3 3 51 3 12 42 $ 14 3 32 3 30 2 10 3 32 46 3 32 4 50 3 3 17 3 3 10 3 22 4 1 44 4 45 Selling price (1000s of 5) 0 259 0 295 0 27.9 0 25.9 0 299 0 299 1 309 0 289 1 1 82.9 0 35 0 315 0 31 0 30.9 1 O 28.9 O 36.9 1 419 0 405 0 1 0 379 1 445 0 379 1 3 0 30.9 0 455 1 7 6 7 0 119 2 15 ! 15 2 1 2 1 2 2 15 2 0 N 8 7 N 0 1 4 3 11 10 BUAD 360-D1 Project I: Regression Analysis Please use the attached dataset (separate Excel file) to analyze the relationship between selling price of houses and each of the independent variables listed. These variables include number of bathrooms, area of site, size of living space, number of garages, number of rooms, number of bedrooms, age in years, and number of fireplaces. Please use multiple regression using Excel for your analysis. Please write a report on your analysis. Your report should be at least 2 pages long and should include the following sections: 1. Introduction 2. Background research on housing prices 3. Description of data set 4. Methodology used (Multiple Regression) 5. Results 6. Concluding Remarks The result section should also contain the following table. Please denote the independent variables as X1 = number of bathrooms, X2 = area of site, X3 = size of living space, etc. Coefficient p-value Constant # of bathrooms (XI) X2 X3 X4 XS X6 X7 X8 N- F-statistic Significance of F- R-squared R- Please write out the estimated relationship as well Y-hat=b0+ b1X1 + b2X2 + b3X3 + b4X4 + b5X5 + b6X6 + b7X7+b8X8 No. of bathrooms No. of garages No. of fire places Age in years 42 4 1 . No. of rooms No. of hedreams 2 7 6 1 1 Size of living space (1000 sqm) 0.99% 1.5 1.175 1.232 L121 0.95% 1.24 1.501 142 1 2 1 1 1 1 1 4 3 3 3 3 40 54 . 1 Area of sile 1000 m 3.472 3.531 2.275 4.00 4.455 4.455 5.85 9.52 98 128 6.415 + 5.52 6 6 3 3 7 6 10 9 56 51 32 42 5 S 6 2 2 2 1 1 2 0 3 6 S 6 5 6 2 3 1 1 2.5 2.5 1 1 1 1 1 1 1.5 1.5 1.5 1 1 1.5 1.5 1.5 1.5 5 1.225 1.552 0.975 1121 1.02 1.501 1.664 1.488 1.376 1.5 1.256 1.60 Selling price 1000s of S) 0 25.9 0 29.5 0 27,9 0 25.9 0 29.9 0 29,9 1 10.9 0 1 84,9 1 82.9 0 35.9 0 31.5 0 0 30.9 1 20 O 28.9 0 36,9 1 41.9 0 40.5 0 1 37.5 0 37.9 1 445 0 37.9 1 $8.9 0 36,9 O 4. 1 30 30 32 46 32 SO 22 17 23 3 4 8 7 6 2 15 1 15 2 1 7 5.15 6902 7.100 7.8 5.52 4 99 6.7266 9.15 8 7.3262 5 0 6 X 3 3 5 3 4 40 22 SO 44 3 1.652 1.777 1.504 1x31 1.2 NNN 6 8 7 4 3 48 3 31 30 4 1.5 1.5 No. of bathrooms Area of site (1000 sq ft) Size of living space (1000 sq ft) 1 3.472 0.998 1 3531 1.5 1 2.275 1.175 1 4.05 1.232 1 4.455 1.121 ! 4455 0.958 1 5.85 1.24 1 9.52 1.501 25 98 225 128 3 1 6.435 1.225 ! 4.983 1.552 . 5.52 0975 1 66 1.121 1 5 1.02 1 9.52 1.501 1.5 5.15 1.664 1.5 1.5 7.102 1.176 1 1.5 1 5.52 1.256 1.3 4 1.69 1.5 182 1.5 1652 1.5 9.15 1.772 1 1.504 1.5 7.3262 LJI 1.5 5 12 No of garages No ofron No. of bedrooms 1 7 2 7 1 6 1 6 1 6 ! 6 1 7 0 6 2 10 2 9 6 1 6 1 5 2 6 5 Age in years No. of fire places 4 42 4 62 10 3 $4 3 42 3 3 51 3 12 42 $ 14 3 32 3 30 2 10 3 32 46 3 32 4 50 3 3 17 3 3 10 3 22 4 1 44 4 45 Selling price (1000s of 5) 0 259 0 295 0 27.9 0 25.9 0 299 0 299 1 309 0 289 1 1 82.9 0 35 0 315 0 31 0 30.9 1 O 28.9 O 36.9 1 419 0 405 0 1 0 379 1 445 0 379 1 3 0 30.9 0 455 1 7 6 7 0 119 2 15 ! 15 2 1 2 1 2 2 15 2 0 N 8 7 N 0 1 4 3 11 10