

Question: Budgets: Students should use linear regression (see Problem 12.1) to project 2015 volumes and changing financial class of patients. also For 2015 develop a statistical
Budgets: Students should use linear regression (see Problem 12.1) to project 2015 volumes and changing financial class of patients. also For 2015 develop a statistical budget then develop a revenue budget using a financial model determine whether to increase rates and if so how much and an expense budget in statement of operations format including detailed footnotes explaining any changes in the numbers.
example 12.1 is an example of how to solve the problem from within the text book, the instructor referred to it.
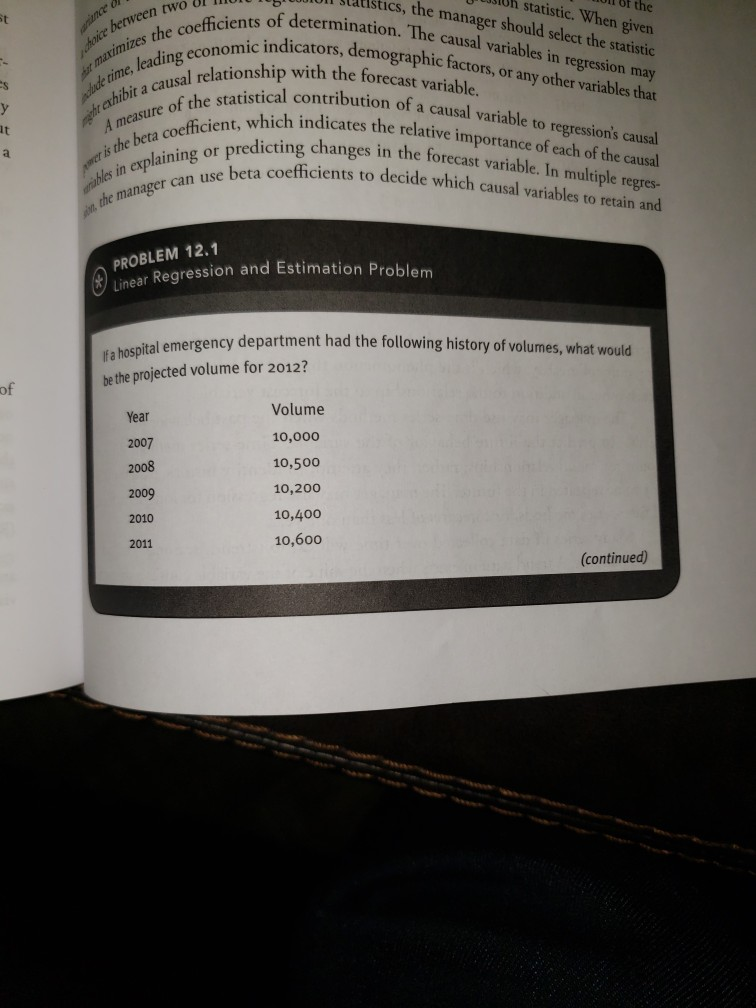
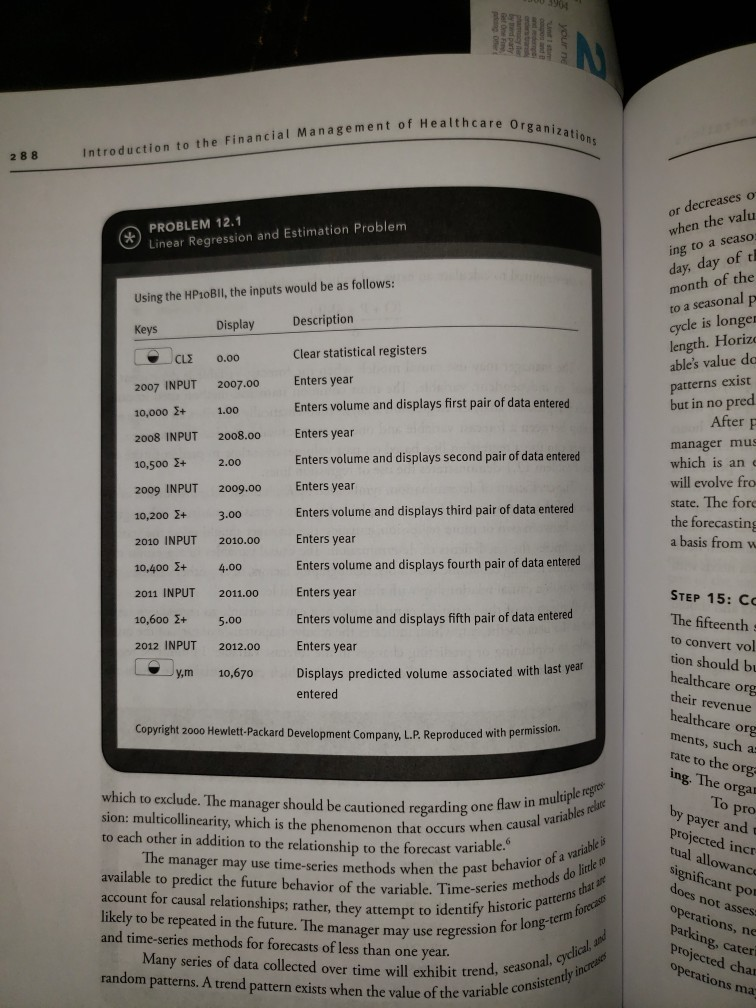
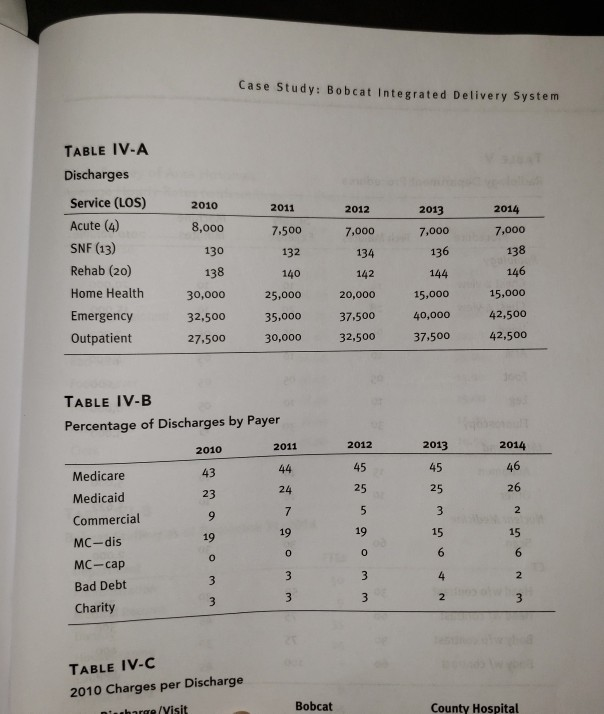
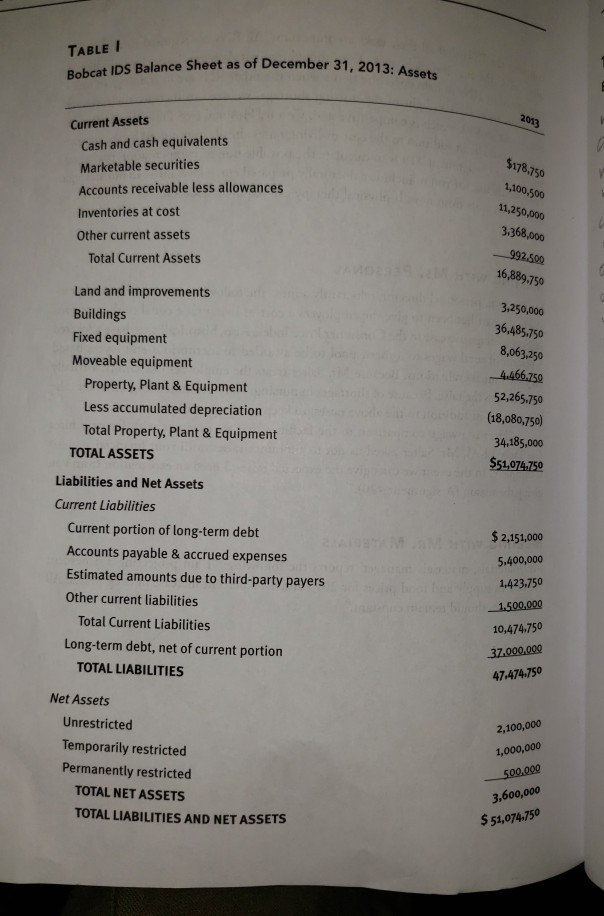
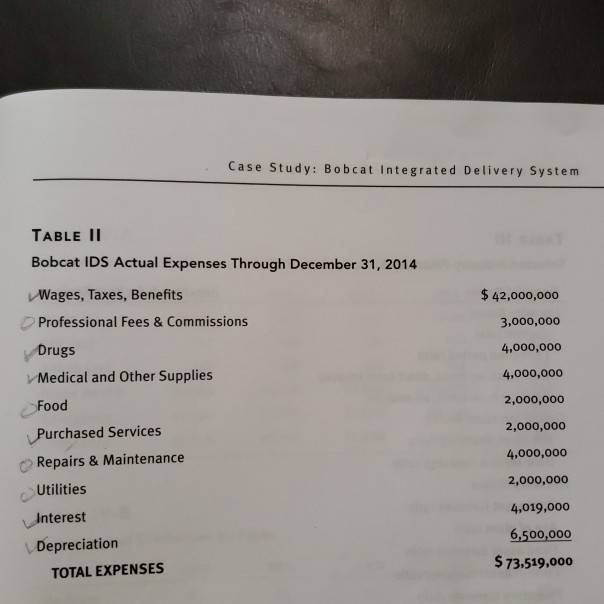
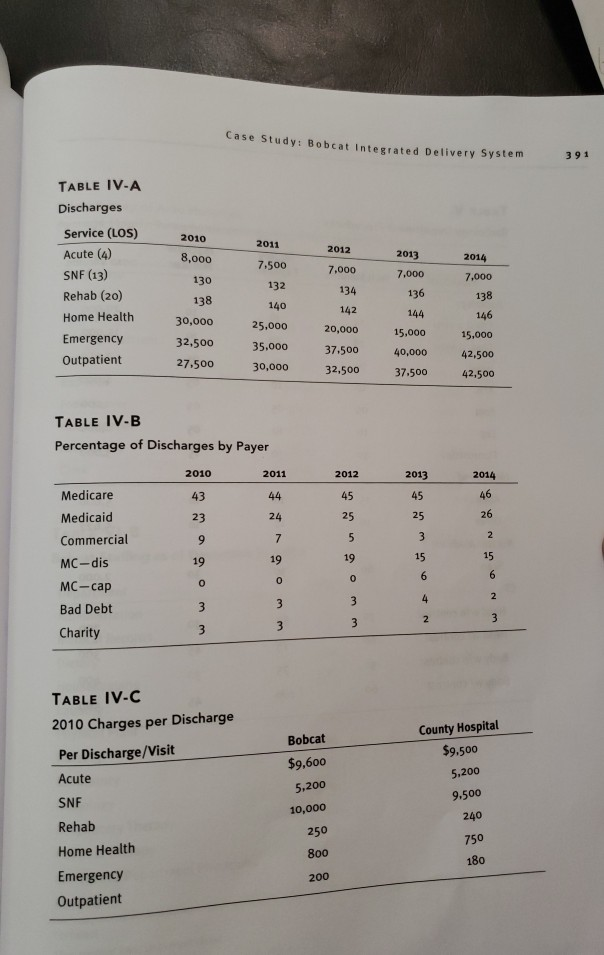
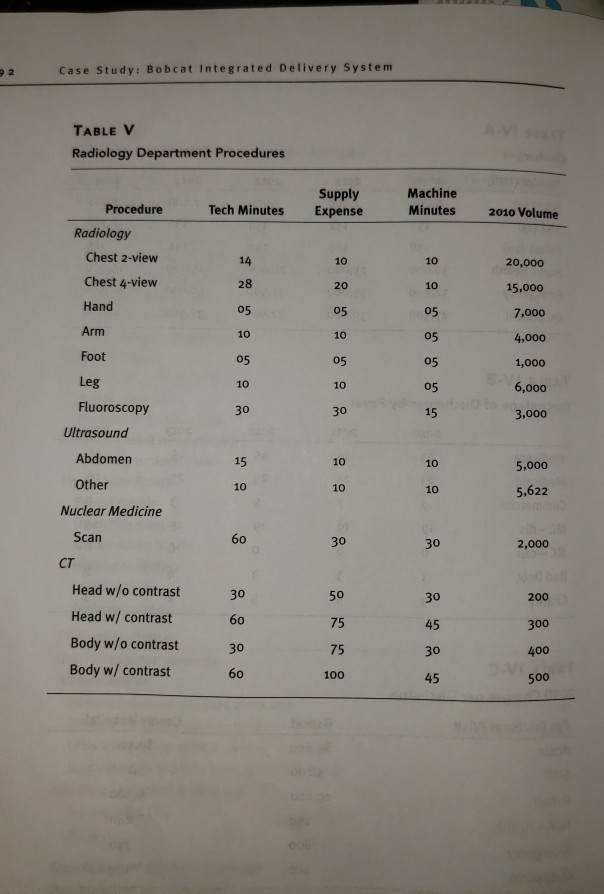
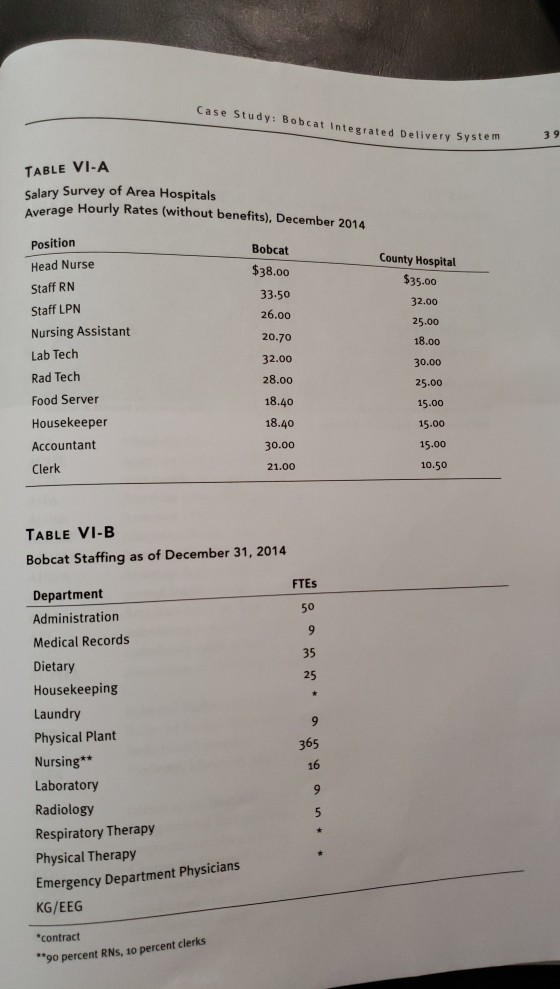
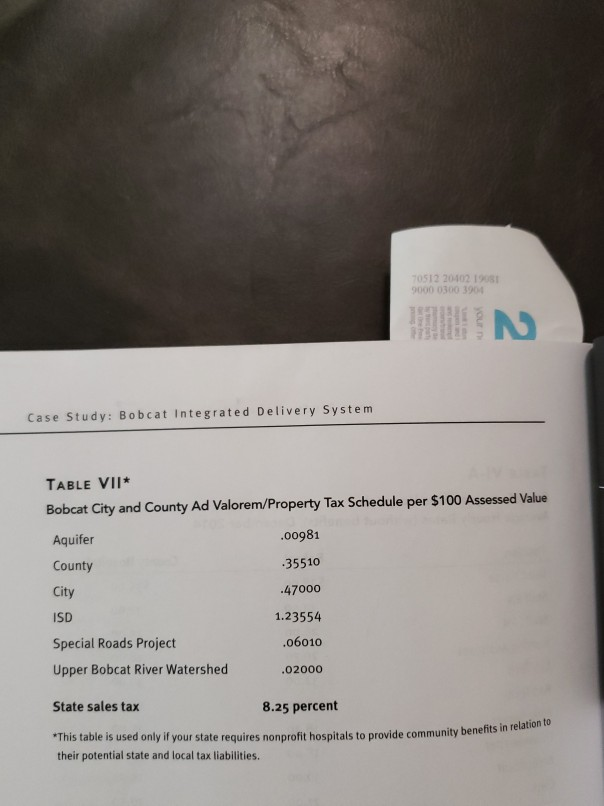
Case Study: Bobcat Integrated Delivery System TABLE IV-A Discharges Service (LOS) Acute (4) SNF (13) Rehab (20) Home Health Emergency Outpatient 2010 2011 2012 2013 2014 8,000 130 138 30,000 7.500 132 140 25,000 7,000 138 146 15,000 7,000 7,000 134 136 142 144 20,000 32.500 35,000 37.500 40,0oo 42,500 27.500 30,00032,500 37.500 42,500 15,000 TABLE IV-B Percentage of Discharges by Payer 2012 45 25 2013 45 25 2014 46 26 2 15 2011 2010 43 23 Medicare Medicaid Commercial MC-dis MC-cap Bad Debt Charity 24 19 19 15 19 0 0 TABLE IV-C 2010 Charges per Discharge Bobcat County Hospital TABLE I Bobcat IDS Balance Sheet as of December 31, 2013: Asset Current Assets 013 Cash and cash equivalents Marketable securities Accounts receivable less allowances Inventories at cost Other current assets $178.750 1,100,500 11,250,000 3.368,000 992.500 16,889,750 Total Current Assets Land and improvements Buildings Fixed equipment Moveable equipment 3.250,000 36,485,750 8,063,250 4:466.750 52,265,750 (18,080,750) 34,185,000 $51,024.750 Property, Plant & Equipment Less accumulated depreciation Total Property, Plant & Equipment TOTAL ASSETS Liabilities and Net Assets Current Liabilities Current portion of long-term debt Accounts payable & accrued expenses Estimated amounts due to third-party payers Other current liabilities $ 2,151,000 5400,000 1,423.750 1500,000 10,474.750 ,000,000 47-474 750 Total Current Liabilities Long-term debt, net of current portion TOTAL LIABILITIES Net Assets Unrestricted Temporarily restricted Permanently restricted 2,100,000 1,000,000 3,600,000 $ 51,074.750 TOTAL NET ASSETS TOTAL LIABILITIES AND NET ASSETS Case Study: Bobcat Integrated Delivery System TABLE I Bobcat IDS Actual Expenses Through December 31, 2014 Wages, Taxes, Benefits $ 42,000,000o Professional Fees & Commissions Drugs Medical and Other Supplies Food 3,000,000 4,000,000 4,000,000 2,000,000 2,000,000 4,000,000 2,000,000 Purchased Services Repairs & Maintenance Utilities nterest Depreciation 4,019,000 6,500,000 $ 73.519,000o TOTAL EXPENSES Case Study: Bobcat Integrated Delivery System TABLE V Radiology Department Procedures Supply Tech Minutes Expense Machine Minutes Procedure 2010 Volume Radiology Chest 2-view Chest 4-view Hand Arm Foot Leg Fluoroscopy 28 05 10 05 10 30 10 20 05 10 05 10 30 10 10 05 05 05 05 15 20,000 15,000 7,000 4,000 1,000 6,000 3,000 Ultrasound Abdomen 15 10 10 5,000 Other 10 10 10 5,622 Nuclear Medicine Scan 60 30 30 2,000 Head w/o contrast Head w/ contrast Body w/o contrast Body w/ contrast 30 60 30 60 50 75 75 100 30 45 30 45 200 300 400 500 Case Study: Bobcat Integrated Delivery System 3 9 TABLE VI-A Salary Survey of Area Hospitals Average Hourly Rates (without benefits), December 2014 Position Head Nurse Staff RN Staff LPN Nursing Assistant Lab Tech Rad Tech Food Server Housekeeper Accountant Clerk Bobcat $38.00 33.50 26.00 20.70 32.00 28.00 18.40 18.40 30.00 21.00 County Hospital 35.00 32.00 25.00 18.00 30.00 25.00 15.00 15.00 15.00 10.50 TABLE VI-B Bobcat Staffing as of December 31, 2014 FTEs Department Administration Medical Records Dietary Housekeeping Laundry Physical Plant Nursing** Laboratory Radiology Respiratory Therapy Physical Therapy Emergency Department Physicians KG/EEG contract 9o percent RNs, 10 percent clerks 50 35 25 365 16 0512 20402 19081 000 0300 3904 Case Study: Bobcat Integrated Delivery System TABLE VII Bobcat City and County Ad Valorem/Property Tax Schedule per $100 Assessed Value Aquifer County City ISD Special Roads Project Upper Bobcat River Watershed State sales tax 00981 35510 47000 1.23554 06010 02000 8.25 percent This table is used only if your state requires nonprofit hospitals to provide community bene their potential state and local tax liabilities ion to en ullstics, Uh statistic. the r bf the oefcients of determination. The causal variab When given manager should select the statistic between two l ll mic indicators, demographic factors, or tionship with the forecast variable. imizes variabl es in regression may any other variabl exhibit a causal asure es that tion of a causal variable to regression's causal cient, which indicates the relative importance of each of the causal of the statistical contribution a it redicting changes in the forecast variable. In multiple regres si oplinngrheta coefficients to decide which causal variables to retain and in manager can use beta coefficien PROBLEM 12.1 Linear Reg ression and Estimation Problem ency department had the following history of volumes, what would bethe projected volume for 2012? of Year 2007 2008 2009 2010 2011 Volume 10,000 10,500 10,200 10,400 10,600 (continued) 288 Introduction to the Financial Management of Healthcare or decreases o when the valu ing to a seaso day day of t month of the to a seasonal p cycle is longer length. Horiz able's value do patterns exist but in no pred After p manager mus which is an e will evolve fro state. The fore the forecasting a basis from w PROBLEM 12.1 Linear Regression and Estimation Problem Using the HP10BII, the inputs would be as follows: Keys Display Description Clear statistical registers -, CL2 0.00 2007 INPUT 2007.0o Enters year 10,000 + 1.00 2008 INPUT 2008.00 Enters year 10,500 2 2.00 2009 INPUT 2009.00 Enters year 10,200 + 3.00 2010 INPUT 2010.0o Enters year 10,400 2 4.00 2011 INPUT 2011.00 Enters year 10,600 + 5.00 2012 INPUT 2012.00Enters year Enters volume and displays first pair of data entered Enters volume and displays second pair of data entered Enters volume and displays third pair of data entered Enters volume and displays fourth pair of data entere STEP 15: C The fifteenth to convert vol tion should b Enters volume and displays fifth pair of data entered Displays predicted volume associated with last year entered Jy.m10,670 their revenue Copyright 2000 Hewlett-Packard Development Company, L.P. Reproduced with permission. ments, such a rate to the org ing. The orgar which to exclude. The manager should be cautioned regarding one faw i sion: multicollinearity, which is the phenomenon that occurs vw to each other in addition to the relationship to the forecast variable. To pro in mul usal ti ariables payer and projected incr tual allowance The manage may u time-series methods when the past behave available to predict the future behavior of the variable. Time-series m account for causal relationships, rather, they attempt to identify historn likely to be repeated in the future. The manager may use regression and time-series methods for forecasts of less than one year. significant por does not asses operations, ne parking, cateri projected char operations ma for long-term foreats for lon Many series of data collected over time will exhibit trend, seaso random patterns. A trend pattern exists when the value of the variable co consistently Case Study: Bobcat Integrated Delivery System TABLE IV-A Discharges Service (LOS) Acute (4) SNF (13) Rehab (20) Home Health Emergency Outpatient 2010 2011 2012 2013 2014 8,000 130 138 30,000 7.500 132 140 25,000 7,000 138 146 15,000 7,000 7,000 134 136 142 144 20,000 32.500 35,000 37.500 40,0oo 42,500 27.500 30,00032,500 37.500 42,500 15,000 TABLE IV-B Percentage of Discharges by Payer 2012 45 25 2013 45 25 2014 46 26 2 15 2011 2010 43 23 Medicare Medicaid Commercial MC-dis MC-cap Bad Debt Charity 24 19 19 15 19 0 0 TABLE IV-C 2010 Charges per Discharge Bobcat County Hospital TABLE I Bobcat IDS Balance Sheet as of December 31, 2013: Asset Current Assets 013 Cash and cash equivalents Marketable securities Accounts receivable less allowances Inventories at cost Other current assets $178.750 1,100,500 11,250,000 3.368,000 992.500 16,889,750 Total Current Assets Land and improvements Buildings Fixed equipment Moveable equipment 3.250,000 36,485,750 8,063,250 4:466.750 52,265,750 (18,080,750) 34,185,000 $51,024.750 Property, Plant & Equipment Less accumulated depreciation Total Property, Plant & Equipment TOTAL ASSETS Liabilities and Net Assets Current Liabilities Current portion of long-term debt Accounts payable & accrued expenses Estimated amounts due to third-party payers Other current liabilities $ 2,151,000 5400,000 1,423.750 1500,000 10,474.750 ,000,000 47-474 750 Total Current Liabilities Long-term debt, net of current portion TOTAL LIABILITIES Net Assets Unrestricted Temporarily restricted Permanently restricted 2,100,000 1,000,000 3,600,000 $ 51,074.750 TOTAL NET ASSETS TOTAL LIABILITIES AND NET ASSETS Case Study: Bobcat Integrated Delivery System TABLE I Bobcat IDS Actual Expenses Through December 31, 2014 Wages, Taxes, Benefits $ 42,000,000o Professional Fees & Commissions Drugs Medical and Other Supplies Food 3,000,000 4,000,000 4,000,000 2,000,000 2,000,000 4,000,000 2,000,000 Purchased Services Repairs & Maintenance Utilities nterest Depreciation 4,019,000 6,500,000 $ 73.519,000o TOTAL EXPENSES Case Study: Bobcat Integrated Delivery System TABLE V Radiology Department Procedures Supply Tech Minutes Expense Machine Minutes Procedure 2010 Volume Radiology Chest 2-view Chest 4-view Hand Arm Foot Leg Fluoroscopy 28 05 10 05 10 30 10 20 05 10 05 10 30 10 10 05 05 05 05 15 20,000 15,000 7,000 4,000 1,000 6,000 3,000 Ultrasound Abdomen 15 10 10 5,000 Other 10 10 10 5,622 Nuclear Medicine Scan 60 30 30 2,000 Head w/o contrast Head w/ contrast Body w/o contrast Body w/ contrast 30 60 30 60 50 75 75 100 30 45 30 45 200 300 400 500 Case Study: Bobcat Integrated Delivery System 3 9 TABLE VI-A Salary Survey of Area Hospitals Average Hourly Rates (without benefits), December 2014 Position Head Nurse Staff RN Staff LPN Nursing Assistant Lab Tech Rad Tech Food Server Housekeeper Accountant Clerk Bobcat $38.00 33.50 26.00 20.70 32.00 28.00 18.40 18.40 30.00 21.00 County Hospital 35.00 32.00 25.00 18.00 30.00 25.00 15.00 15.00 15.00 10.50 TABLE VI-B Bobcat Staffing as of December 31, 2014 FTEs Department Administration Medical Records Dietary Housekeeping Laundry Physical Plant Nursing** Laboratory Radiology Respiratory Therapy Physical Therapy Emergency Department Physicians KG/EEG contract 9o percent RNs, 10 percent clerks 50 35 25 365 16 0512 20402 19081 000 0300 3904 Case Study: Bobcat Integrated Delivery System TABLE VII Bobcat City and County Ad Valorem/Property Tax Schedule per $100 Assessed Value Aquifer County City ISD Special Roads Project Upper Bobcat River Watershed State sales tax 00981 35510 47000 1.23554 06010 02000 8.25 percent This table is used only if your state requires nonprofit hospitals to provide community bene their potential state and local tax liabilities ion to en ullstics, Uh statistic. the r bf the oefcients of determination. The causal variab When given manager should select the statistic between two l ll mic indicators, demographic factors, or tionship with the forecast variable. imizes variabl es in regression may any other variabl exhibit a causal asure es that tion of a causal variable to regression's causal cient, which indicates the relative importance of each of the causal of the statistical contribution a it redicting changes in the forecast variable. In multiple regres si oplinngrheta coefficients to decide which causal variables to retain and in manager can use beta coefficien PROBLEM 12.1 Linear Reg ression and Estimation Problem ency department had the following history of volumes, what would bethe projected volume for 2012? of Year 2007 2008 2009 2010 2011 Volume 10,000 10,500 10,200 10,400 10,600 (continued) 288 Introduction to the Financial Management of Healthcare or decreases o when the valu ing to a seaso day day of t month of the to a seasonal p cycle is longer length. Horiz able's value do patterns exist but in no pred After p manager mus which is an e will evolve fro state. The fore the forecasting a basis from w PROBLEM 12.1 Linear Regression and Estimation Problem Using the HP10BII, the inputs would be as follows: Keys Display Description Clear statistical registers -, CL2 0.00 2007 INPUT 2007.0o Enters year 10,000 + 1.00 2008 INPUT 2008.00 Enters year 10,500 2 2.00 2009 INPUT 2009.00 Enters year 10,200 + 3.00 2010 INPUT 2010.0o Enters year 10,400 2 4.00 2011 INPUT 2011.00 Enters year 10,600 + 5.00 2012 INPUT 2012.00Enters year Enters volume and displays first pair of data entered Enters volume and displays second pair of data entered Enters volume and displays third pair of data entered Enters volume and displays fourth pair of data entere STEP 15: C The fifteenth to convert vol tion should b Enters volume and displays fifth pair of data entered Displays predicted volume associated with last year entered Jy.m10,670 their revenue Copyright 2000 Hewlett-Packard Development Company, L.P. Reproduced with permission. ments, such a rate to the org ing. The orgar which to exclude. The manager should be cautioned regarding one faw i sion: multicollinearity, which is the phenomenon that occurs vw to each other in addition to the relationship to the forecast variable. To pro in mul usal ti ariables payer and projected incr tual allowance The manage may u time-series methods when the past behave available to predict the future behavior of the variable. Time-series m account for causal relationships, rather, they attempt to identify historn likely to be repeated in the future. The manager may use regression and time-series methods for forecasts of less than one year. significant por does not asses operations, ne parking, cateri projected char operations ma for long-term foreats for lon Many series of data collected over time will exhibit trend, seaso random patterns. A trend pattern exists when the value of the variable co consistently
Step by Step Solution
There are 3 Steps involved in it

Get step-by-step solutions from verified subject matter experts