

Question: Your supervisor needs some help performing financial analysis concerning two companies? TELUS Corporation (TU) and CGI Inc. (GIB). She asked you to: 1. Download each
Your supervisor needs some help performing financial analysis concerning two companies? TELUS Corporation (TU) and CGI Inc. (GIB). She asked you to:
1. Download each company's annual income statements, balance sheets and cash flow statements for the latest four fiscal years. Your supervisor suggested you get the financial statements on Morningstar (https://www.morningstar.com). Enter each company's stock symbol and then go to "Financials." Export the statements to Excel by clicking the export button. Of course, you can always use other reliable sources and cite them accordingly.
2. Find historical stock prices for each firm. Your supervisor recommended you get the historical stock prices on Yahoo! Finance (https://finance.yahoo.com/). Enter the stock symbol, click "Historical Prices" in the left column, and find the closing stock prices for the last day of each year in the financial statements. Use the closing stock prices (not the adjusted close prices). Note that Yahoo! Finance lists the prices in USD but the financial statements are in CAD. Update the historical stock prices to CAD in your spreadsheet.
To calculate the firm's market capitalization (or market value of equity), multiply the number of shares outstanding by the firm's historical stock price. To get the number of shares outstanding, use "Basic Weighted Average Shares Outstanding" from the income statements.
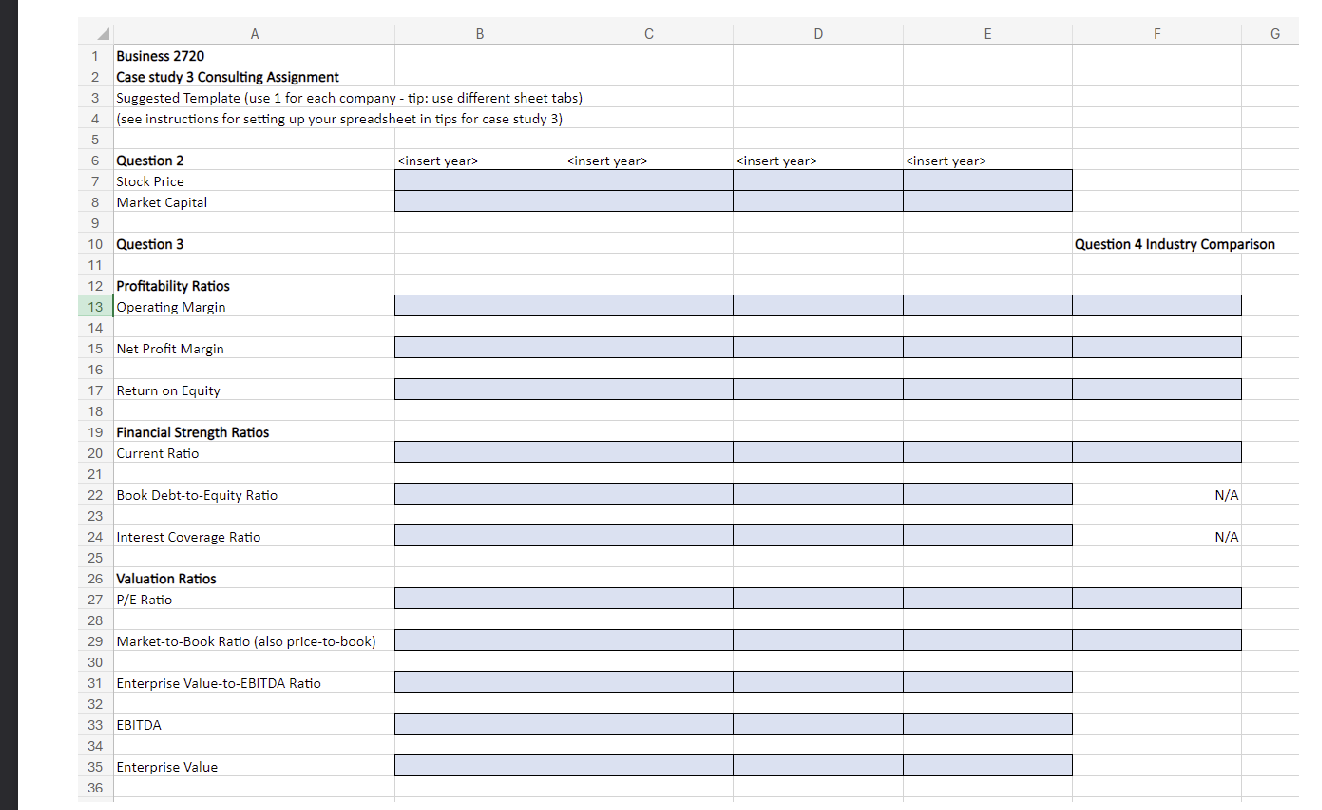
3. For each of the four years of statements, compute the following ratios for each firm:
Profitability Ratios Operating Margin equals Operating Income divided by Sales (you can use "Total Operating Profit/Loss" / "Revenue"). Net Profit Margin equals Net Income divided by Sales (you can use "Net Income Available to Common Stakeholders " / "Revenue"). Return on Equity equals Net Income divided by Book Value of Equity (you can use "Net Income Available to Common Stakeholders " / "Total Equity"). Financial Strength Ratios Current Ratio equals Current Assets divided by Current Liabilities (you can use "Total Current Assets" / "Total Current Liabilities"). Book Debt-to-Equity Ratio equals Total Debt divided by Total Equity (you can use "Total Liabilities" / "Total Equity"). Interest Coverage Ratio equals EBIT divided by Interest Expense (you can use "Total Operating Profit/Loss" / "Interest Expense Net of Capitalized Interest"). Valuation Ratios Price-Earnings (P/E) Ratio equals Stock Price divided by Earnings per Share (EPS) (you can use "Stock Price" / "Diluted EPS Total"). Market-to-Book Ratio equals Market Value of Equity divided by the Book Value of Equity (you can use "Market Capitalization" / "Total Equity"). Enterprise Value-to-EBITDA equals Enterprise Value divided by EBITDA. Where EBITDA equals EBIT + Depreciation and Amortization. (you can use "Total Operating Profit/Loss" + (-"Accumulated Depreciation") + (-"Accumulated Amortization of Intangible Assets")) Note: when calculating EBITDA, you should use the depreciation and amortization as positive values, even though they are typically listed as negative on the financial statements. This is because depreciation and amortization are non-cash expenses that reduce net income, but for EBITDA calculation, they are added back to EBIT to reflect the company's operating performance without these non-cash charges. Where Enterprise Value equals Market Capitalization + Debt - Cash. (you can use "Market Capitalization" + ("Current Debt and Capital Lease Obligation" + "Long Term Debt and Capital Lease Obligation") - "Cash, Cash Equivalents and Short Term Investments"). 4.Your supervisor told you she must conduct a comparative analysis using your calculated values. Thus, she asked you to obtain industry averages for each firm from CNBC (www.cnbc.com). Search for the stock symbol in the top search bar from the main page, then click the "Peers" tab from the stock page, then the "Key Measures" tab. (She told you to ignore the company's column as your calculations will differ.) You wanted to impress her for future employment or letters of recommendation, so you told her you wanted to give the comparative analysis a shot to learn more about it.
So, she asked you to:
Compare each firm's ratios for the most recent year to the available industry ratios (telecommunications and IT services). Analyze each firm's performance versus the industry and comment on trends in each firm's performance. Identify any strengths or weaknesses you find in each firm. Examine the Market-to-Book ratios you calculated for each firm. Which of the two firms can be considered "growth firms," and which can be considered "value firms"? Compare the valuation ratios across the two firms. How do you interpret the difference between them? Consider the enterprise value of each firm for each of the four years. How have the values of each firm changed over time? Upload your case study solution here: Case Study 3. Your upload must consist of a well formatted, coloured, and labeled Excel workbook with formula present for all questions where calculations are expected (no static values) and a Word document written in the form of a letter to your supervisor.
Hints:
Note: You can use ChatGPT or web search to assist. When in doubt with any of the questions, please use comments to explain what you did. Ensure you save your file as an Excel file (and not .csv or another file format).
Question 1: Set up your spreadsheet
Follow the instructions in the case study to obtain/download the financial data. A new spreadsheet with a tab for each company's data. Import the financial data for each company into the respective sheets/tabs, inserting income statements, followed by balance sheets, followed by cash flow statements. Using the template as a guide (see suggested template), create two more tabs, one for each company. You will reference any applicable values from the "data" sheets in your "template" sheets to perform your calculations and analysis. Question 2: Use the template and the instructions in the case study to determine the historical stock prices and market capital. You will need to update the historical stock prices you get from Yahoo! Finance to CAD as the financial statements you download from Morningstar are in CAD. Question 3: Use the template and the case study instructions for the financial calculations. Question 4: Follow the instructions in the case study to obtain industry average for the requested ratios. Enter the information in your template to assist with comparison.
the links to get the data are: https://www.morningstar.com/ https://finance.yahoo.com/ https://www.cnbc.com/
Step by Step Solution
There are 3 Steps involved in it

Get step-by-step solutions from verified subject matter experts