

Question: Build a spreadsheet to answer the following questions. Use a separate worksheet for each ofthe 2 questions. Use the security returns below, to answer the
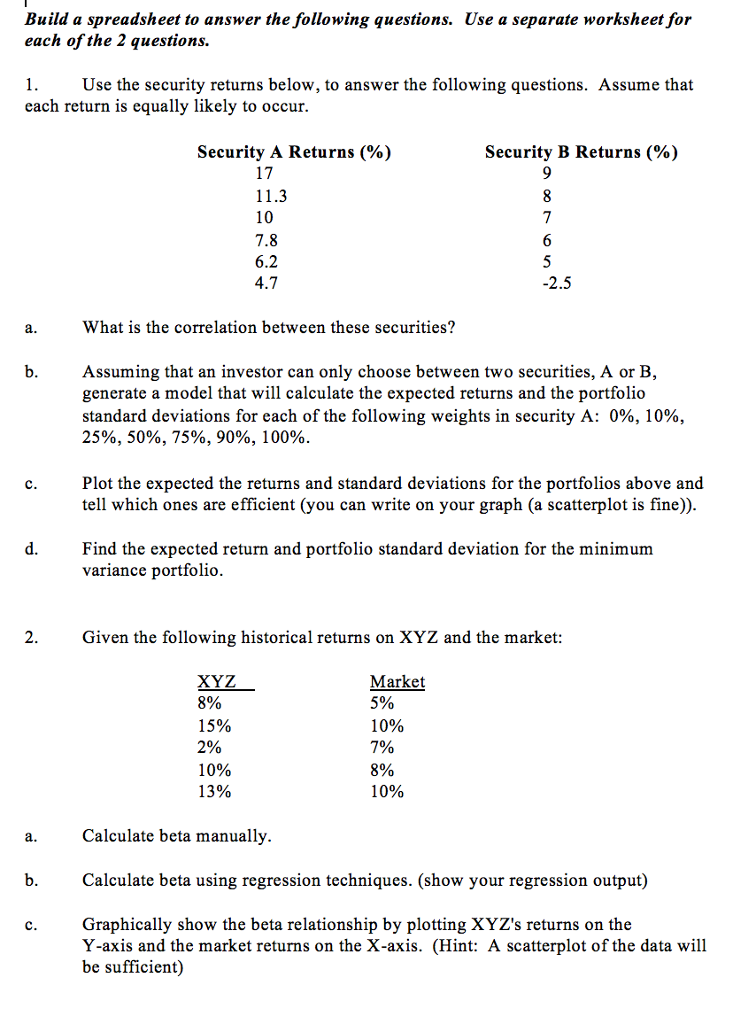
Build a spreadsheet to answer the following questions. Use a separate worksheet for each ofthe 2 questions. Use the security returns below, to answer the following questions. Assume that each return is equally likely to occur Security A Returns (%) Security B Returns (%) 11.3 10 7.8 6.2 2.5 What is the correlation between these securities? Assuming that an investor can only choose between two securities, A or B generate a model that will calculate the expected returns and the portfolio standard deviations for each of the following weights in security A: 0%, 10%, 25%, 50%, 75%, 90%, 100% Plot the expected the returns and standard deviations for the portfolios above and tell which ones are efficient (you can write on your graph (a scatterplot is fine)) Find the expected return and portfolio standard deviation for the minimum variance portfolio Given the following historical returns on XYZ and the market XYZ 8% 15% 2% 10% 13% Market 5% 10% 7% 8% 10% Calculate beta manually b.Calculate beta using regression techniques. (show your regression output) Graphically show the beta relationship by plotting XYZ's returns on the Y-axis and the market returns on the X-axis. (Hint: A scatterplot of the data will be sufficient)
Step by Step Solution
There are 3 Steps involved in it

Get step-by-step solutions from verified subject matter experts