

Question: Burmer Co. has accumulated data to use in preparing its annual profit plan for the upcoming year. The cost behavior pattern of the maintenance costs
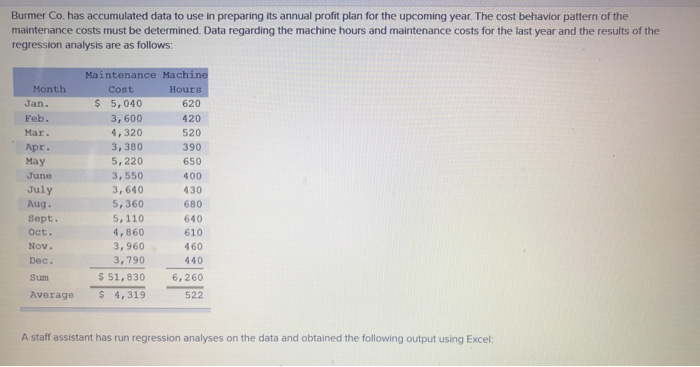
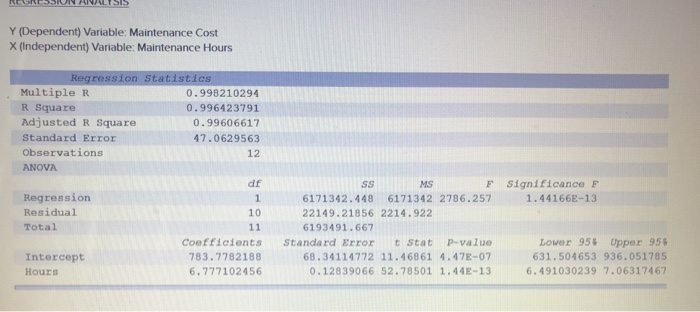
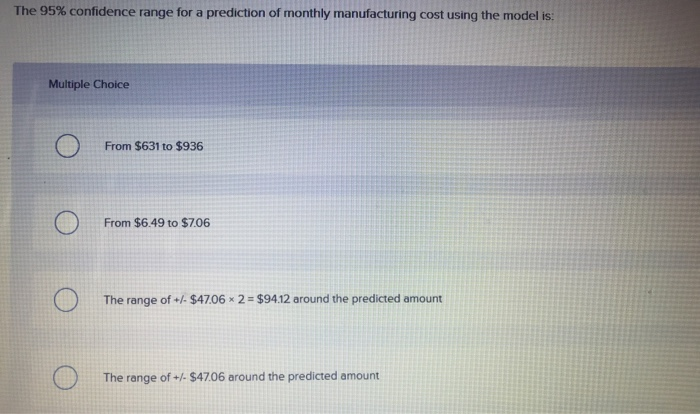
Burmer Co. has accumulated data to use in preparing its annual profit plan for the upcoming year. The cost behavior pattern of the maintenance costs must be determined. Data regarding the machine hours and maintenance costs for the last year and the results of the regression analysis are as follows: Maintenance Machine Month Jan Feb. Mar. Apr. May June July Aug. Sept. Oct Nov. Dec. Sum Average Cost Hours 620 420 520 390 650 400 430 680 640 4,860 610 $ 5,040 3, 600 4, 320 3,380 5,220 3, 550 3,640 , 360 5, 110 460 440 51,830 6,260 522 3, 960 3,790 s 4,319 A staff assistant has run regression analyses on the data and obtained the following output using Excel: Y (Dependent) Variable: Maintenance Cost X (Independent) Variable: Maintenance Hours Multiple R R Square Adjusted R Square Standard Error Observations ANOVA 0.998210294 0.996423791 0.99606617 47.0629563 12 df sS MS F Significance F Regression Residual Total 6171342.448 6171342 2786.257 1.44166E-13 22149.21856 2214.922 6193491.667 10 Coefficients Standard Error t Stat P-value 783.7782188 6.777102456 Lower 95% Upper 95% 631.504653 936.051785 0.12839066 52.78501 1 44E-13 6.491030239 7.06317467 68.34114772 11.46861 4.47E-07 Intercept Hours The 95% confidence range for a prediction of monthly manufacturing cost using the model is: Multiple Choice From $631 to $936 From $6.49 to $706 The range of +/-$4706-2 = $9412 around the predicted amount The range of+- $4706 around the predicted amount
Step by Step Solution
There are 3 Steps involved in it

Get step-by-step solutions from verified subject matter experts